ALL NEW Shipping KPIs & Analytics [Track-POD web 2.0]
Updated on
May 24, 2023
by
Yulia Miashkova
Be among the first to experience Track-POD's brand-new analytics dashboard for shipping KPIs and reports.
Version 2.0 of Track-POD last mile delivery analytics is beta released and available for users of the web dashboard.
In this post, we're taking a look inside.
Shipping KPIs
Plan vs Actual
Customer feedback
Fleet capacity utilized
Reports
Shipping KPIs
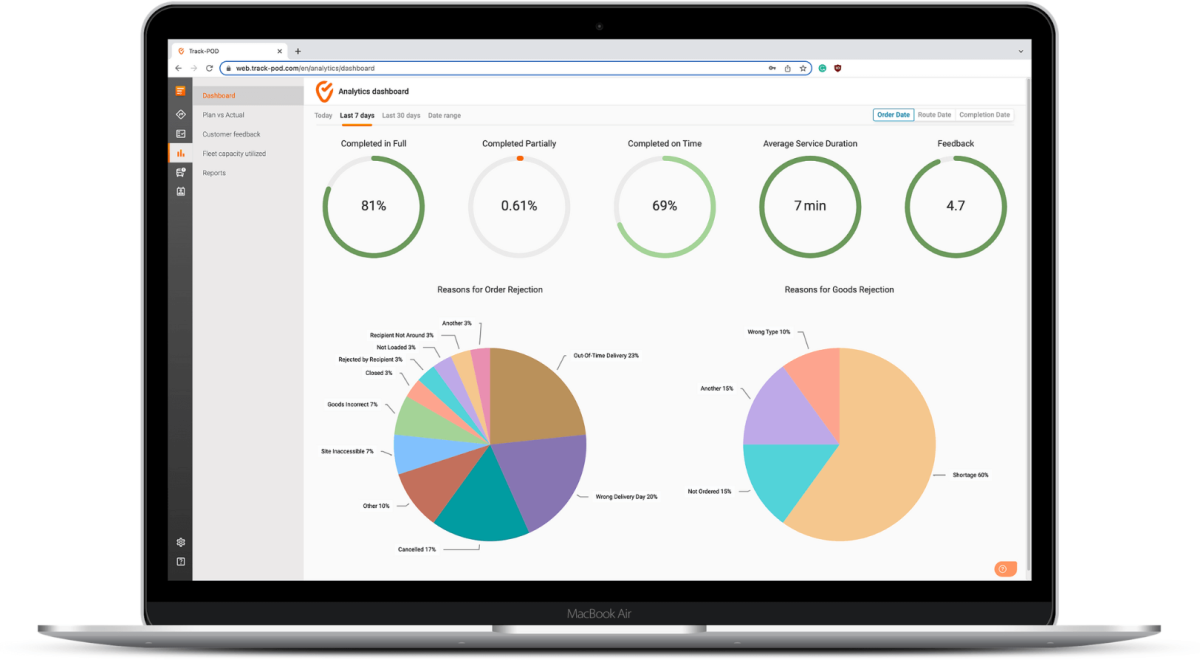
Shipping KPIs is the starting point of analytics as they give you a brief overview of your performance. In Track-POD, you can track the following KPIs for the period of time of your choice.
- Delivery in full.
- Partial delivery.
- On time delivery.
- Average service duration.
- Average customer feedback.
Knowing your DIFOT (Delivery in full, on time) rate is a great starting point in understanding how efficient your delivery operations are. However, without more context around partial and failed deliveries, you're leaving a lot of blind spots.
Luckily, Track-POD comes with customizable reasons for rejection of orders and individual items.
Once you've created your custom reasons and given the drivers the tools to document them via Track-POD delivery driver app, you can see the full picture and address the gaps.
Plan vs Actual
Another way to assess your performance, adjust your strategy, and make the most of your last mile delivery solution is to look at things in perspective. Specifically, how your planned performance compares to your actual numbers.

To help you improve your route planning process, Track-POD allows you to compare your planned vs actual time and distance.
In the same tab, you can also take a look at the number of routes and sites covered in a time period of your choice. Last but not least, you get a breakdown of orders by status and a graph depicting your succeded vs failed orders.
Customer feedback
First-hand feedback from your customers is the best indicator of the kind of experience you're able to deliver with your logistics services. Since Track-POD allows you to collect customer feedback, it also lets you analyze customer satisfaction by driver.
 In addition to the feedback summary, you'll see how many customers rated each driver.
If together with the rating customers left notes, you'll get an overview of those as well.
NEW: Fleet capacity utilized
Fleet capacity utilized is the newest addition to last mile analytics in Track-POD. As the name suggests, it allows you to see how efficiently you're using your fleet resources in terms of loading.
Depending on what capacity units you're using (weight, volume, or pallets), you can see to what extent your fleet resources are used, split by vehicle.
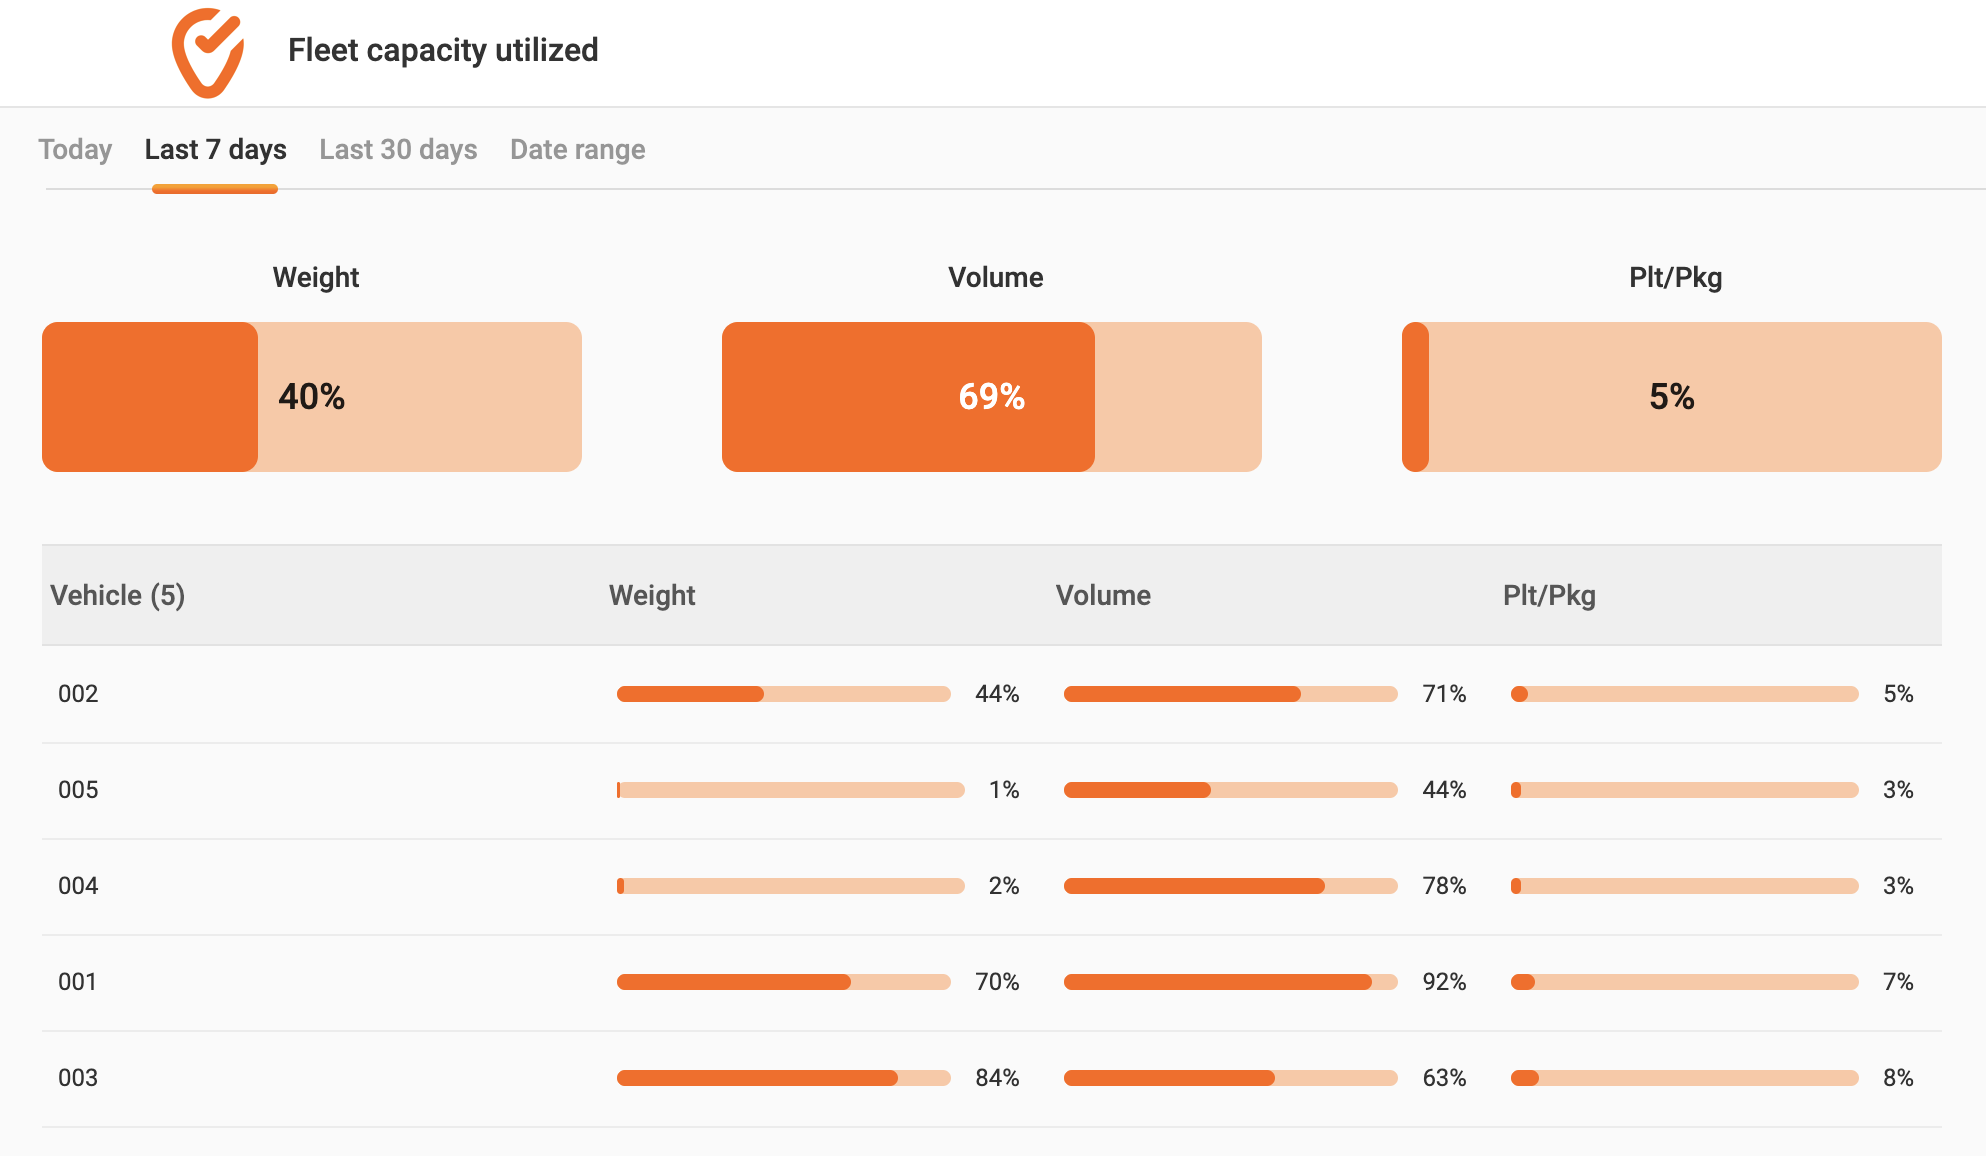
With insights into vehicle capacity utilization, you can make adjustments to your load plan and make sure you don't under/overuse your fleet.
Shipping reports is the goldmine of insights for logistics optimization. Especially seeing how Track-POD allows you to export 12-24 months of historical data with any of our regular subscription plans.
In the new version of analytics, you can find all 6 types of reports that were available in the previous version.
- Driver Statistics.
- Overview of Items.
- Overview of Orders.
- Trip Summary by Routes.
- Route Costs.
- Cost Savings by Time/Distance.

Recap
Analytics is the key part of any logistics software solution. As far as last mile delivery is concerned, there is a number of metrics you should be tracking to have a realistic picture of your performance.
With the new version of Track-POD analytics, you can keep an eye on every moving part of your delivery process. If you'd like a guided tour of our platform, book a custom demo and we'll show you around.
About The Author

Yulia Miashkova
Growth marketing manager with a background in public relations, SEO, social listening, and Account-Based Marketing.