

Best Route Planning Software in 2026
This guide compares Track-POD, RouteManager, Circuit, and Upper, covering features, pricing, routing quality, and best-fit scenarios to help businesses choose the best route planning software for 2026.
Read More
In this series of infographics, we look at statistics from more than 2.5 million successful deliveries made by 500 delivery businesses around the world during 2020 up to and including November, as December is not yet over.
Why did we compare these leading indicators with the outbreak of COVID-19? Well, Coronavirus created major challenges for everyone in the delivery business, with social distancing requiring minimal or even zero contact with others.
Food delivery also became a real salvation for many isolated people during lockdown and so we needed to include the singularly unique and unprecedented variables that made 2020 so challenging.
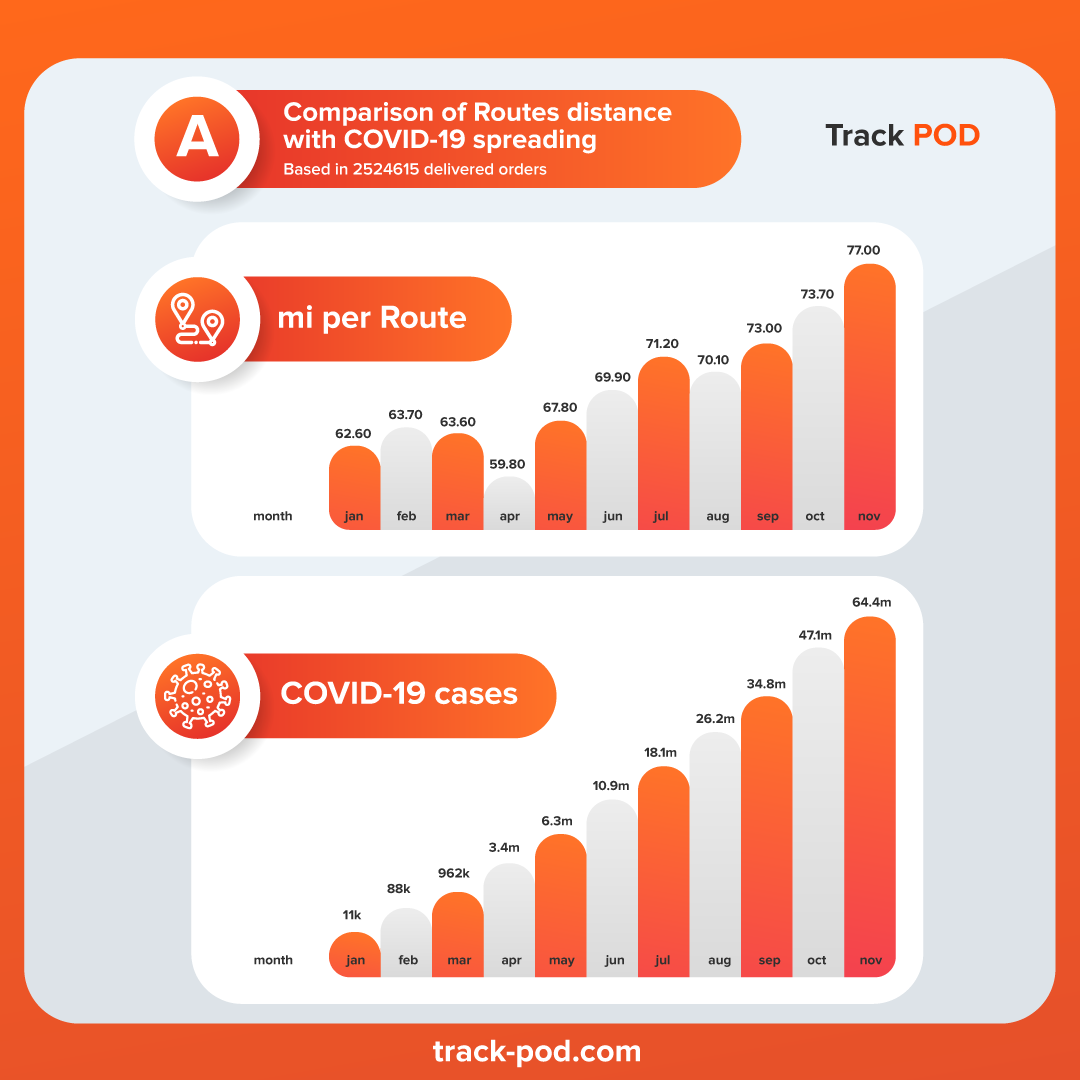
Firstly, we looked at the average increase in distance per route in 2020. The results were impressive at just under 15 miles per year! The suggestion here is that increased orders led to companies better optimizing their routes.
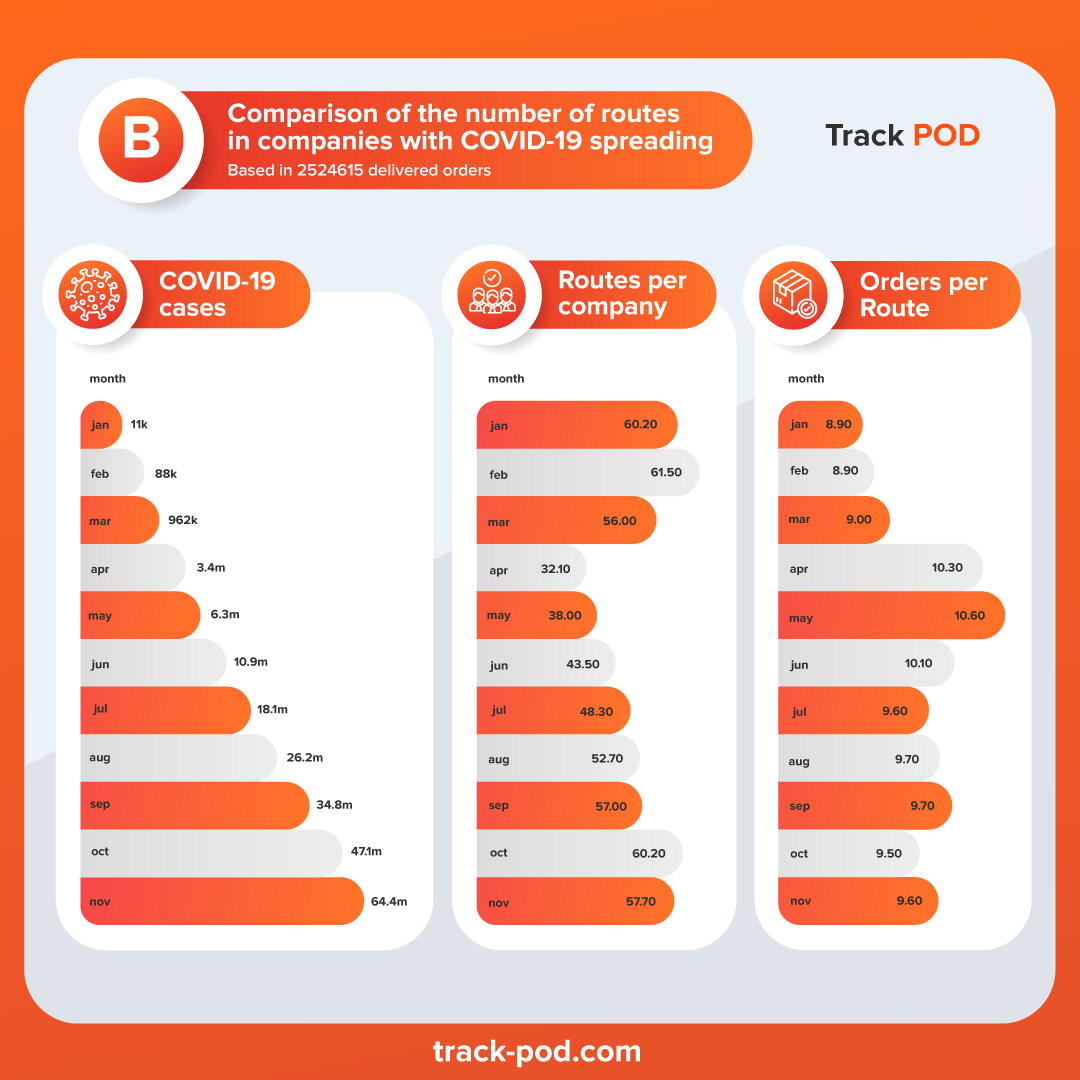
This is indirectly confirmed in the next slide. The number of routes has not increased. In fact, during the Spring and Summer, the number actually fell! That said, the orders per route rate did increase, supporting the notion that companies used route optimization software to cut costs during the Spring.
Route planning for your business
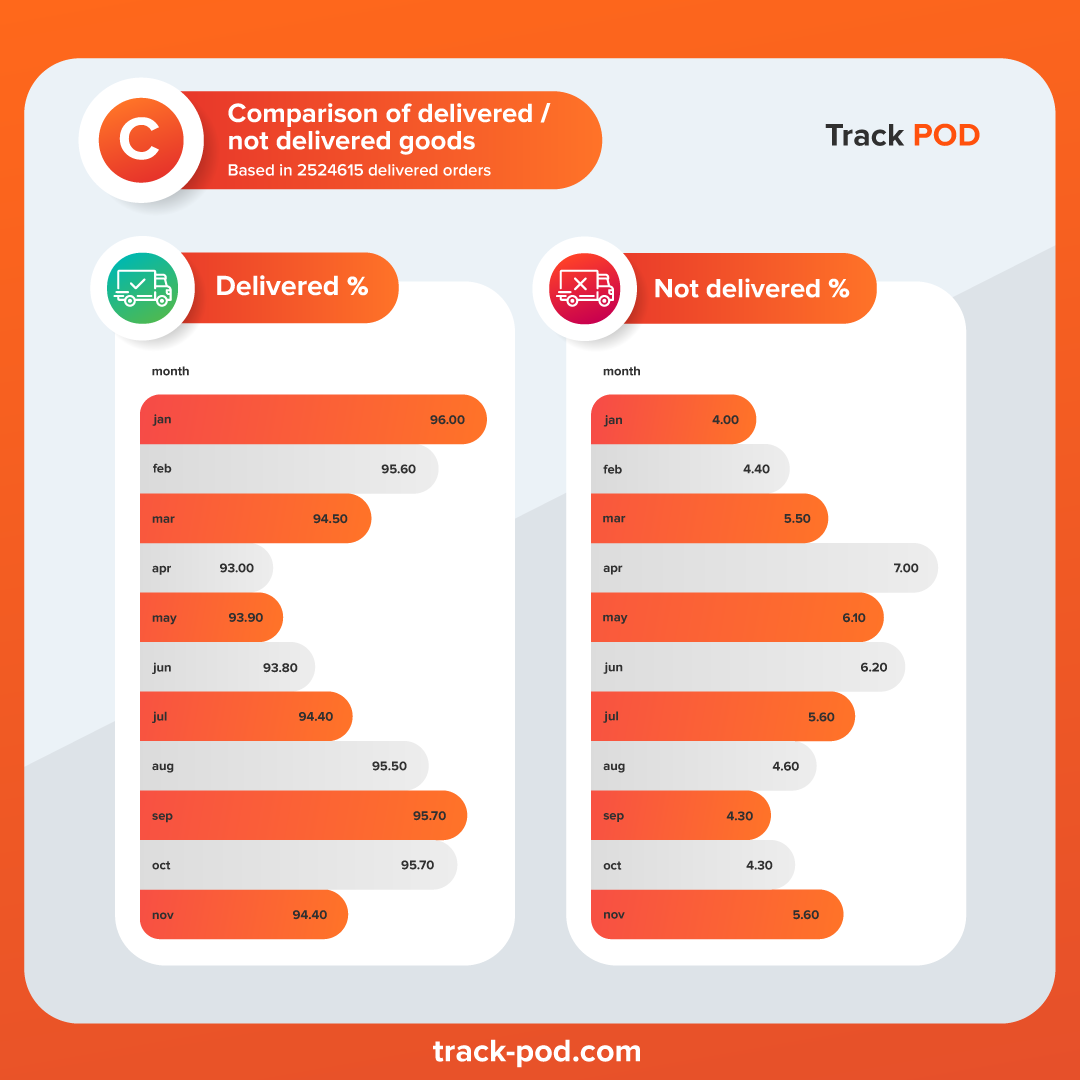
Our third slide looks at the effectiveness of this route optimization. When compared with slide 2, we see a correlation between the number of orders per route and an increase in the percentage of undelivered orders - which invariably result in the cost of repeat delivery. As a business software company, we are looking at how technology can help to solve this problem.
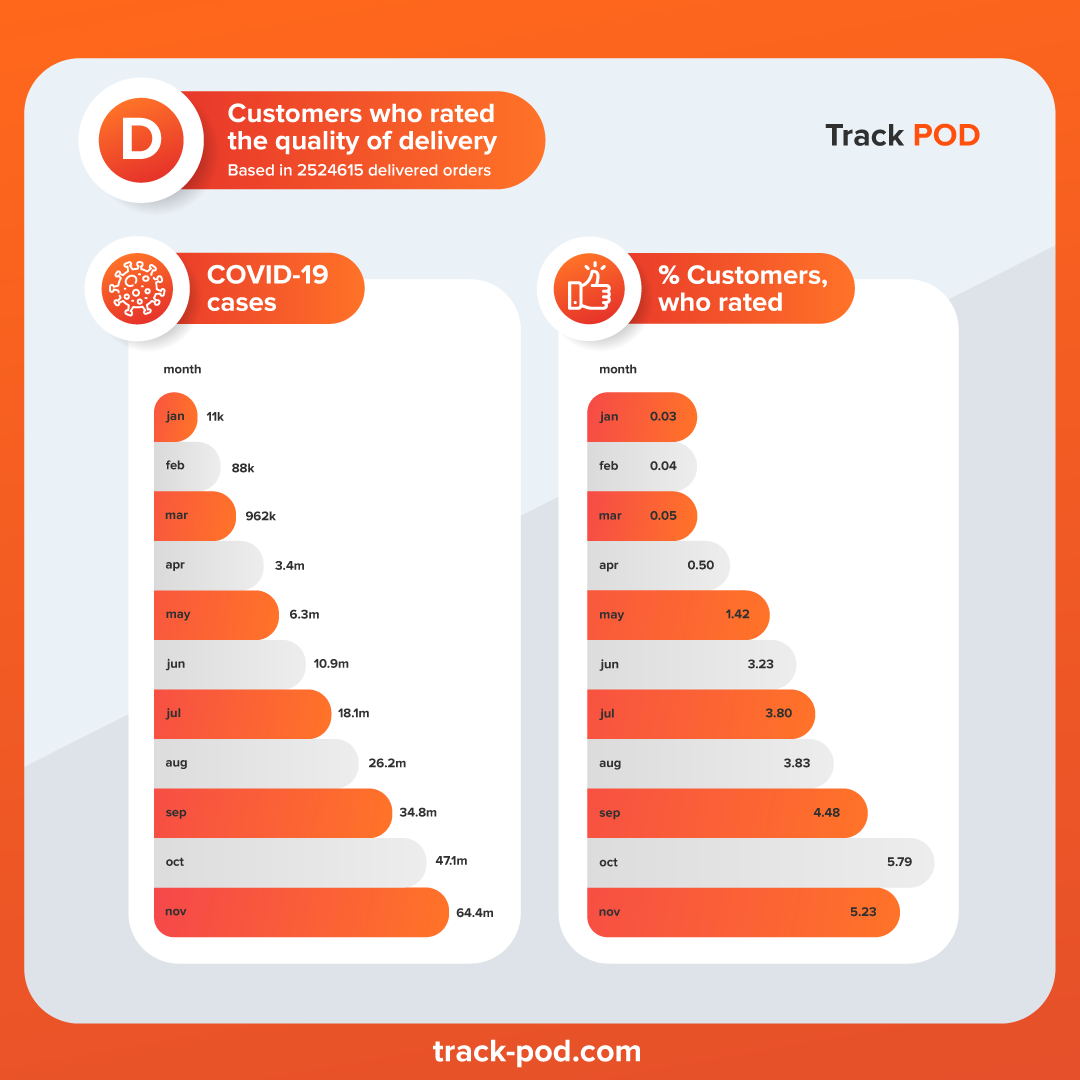
Finally, the fun part of our infographic series. Here we see a considerable increase in the number of people rating the app’s delivery. Awesome numbers that reflect a positive sea change in how deliveries have become valued during the crisis.
Do you have any other ideas that might explain these impressive numbers?
So, this is how 2020 turned out for delivery companies. If your experience has been different, we’d be interested in how your statistics compare and the reasons behind them.
For more information on how Track-POD can help your business take complete control of the delivery process, learn more here.


This guide compares Track-POD, RouteManager, Circuit, and Upper, covering features, pricing, routing quality, and best-fit scenarios to help businesses choose the best route planning software for 2026.
Read More
Guide for starting an e-commerce distribution business: learn about tech reliance and challenges, market research, legal considerations, and efficient route planning considerations.
Read More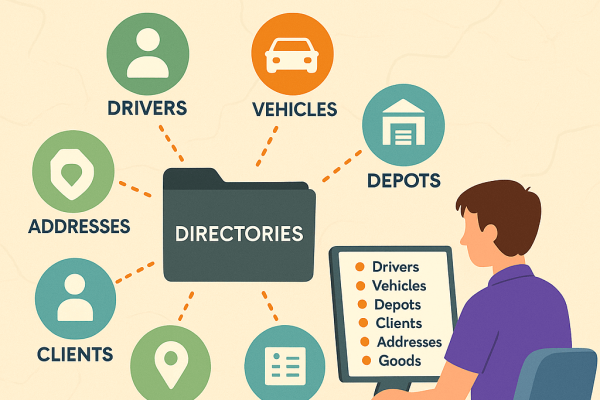
Directories have everything your delivery operation needs. They put drivers, vehicles, clients, and more at your fingertips for faster setup, consistent data, and smarter routing.
Read More