

Best Wholesale Distribution Software for 2026
Discover key features and top picks for wholesale distribution software in 2026 to streamline operations and adapt to a rapidly evolving market.
Read More

Organizing efficient delivery routes with multiple stops is impossible without analytical insights.
Even when your routing and optimization is entrusted to error-free algorithms of route planning software, analytics is what helps you fine-tune your routing machine.
What do we talk about when we talk about predictive analytics in Track-POD? And how can you make the most of it?
This post has all the answers.
Let's start with a generic definition of predictive analytics.
Predictive analytics encompasses methods, tools, and techniques used to analyze real-time and historical data to make predictions concerning future events.
If we observe and analyze any process over a period of time, we can identify trends and anticipate how similar processes will unfold.
From there, we can make predictions and build plans addressing the gaps and laying the groundwork for more efficient utilization of resources and frameworks.

Predictive analytics in logistics refers to real-time and historical data analytics and performance insights that power future route planning and logistics optimization.
On this blog, we've talked about the North Start metric of delivery operations - Delivery In Full, On Time aka On Time and In Full Delivery (DIFOT or OTIF).
While DIFOT is a very good metric for a top-level assessment of your operational efficiency, there are other insights you can dive into using shipment analytics in Track-POD.
By looking back at your drivers' performance over a period of time, you can not only run data-based delivery driver performance evaluation but also make adjustments to your route planning strategy.
What kind of data are we talking about? And where can you find it? Let's take a closer look.
Track-POD is a delivery ecosystem that offers real-time and historical analytics both on desktop and mobile.
As a route manager, you can trace your team's performance up to 2 years back. Let's now review 5 metrics you can check in your Track-POD web dashboard + how you can use these predictive analytics for last-mile optimization.
Average service duration, as the name suggests, is a metric that signifies how long it takes your drivers to perform the delivery service. Like with the rest of shipping KPIs you have in your analytics dashboard, you can adjust the date range and look at your average service duration in perspective.
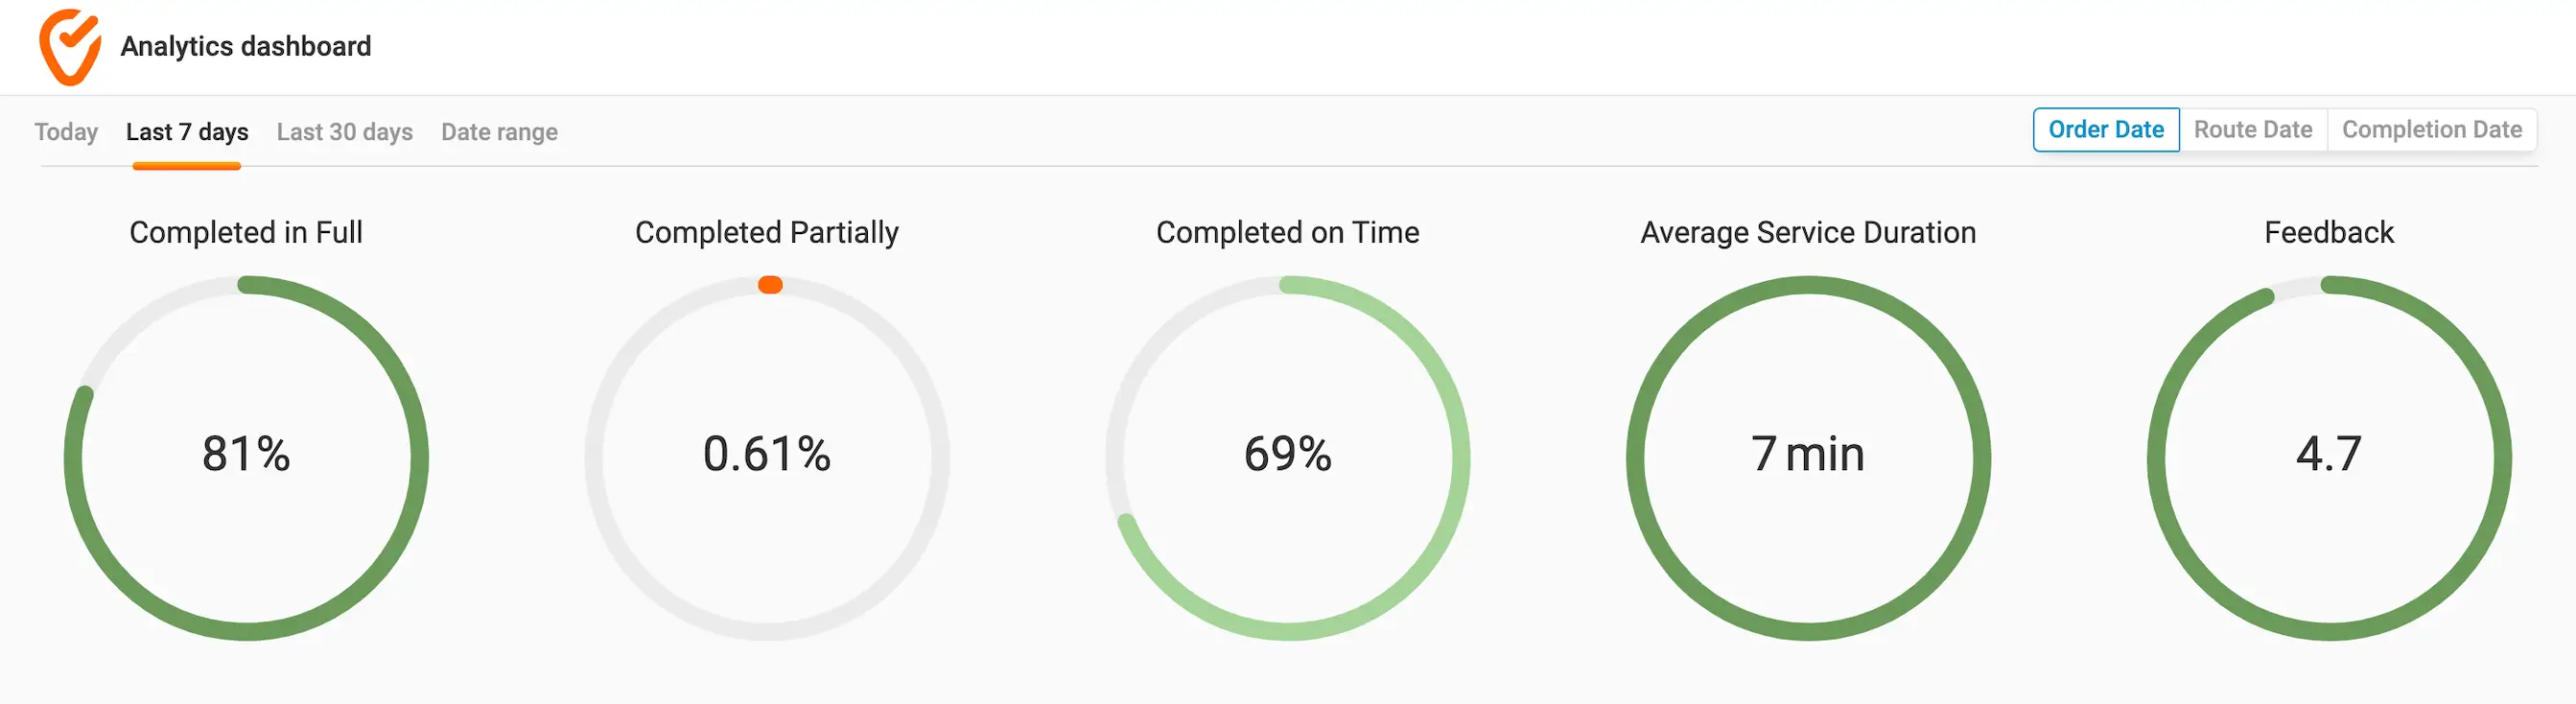
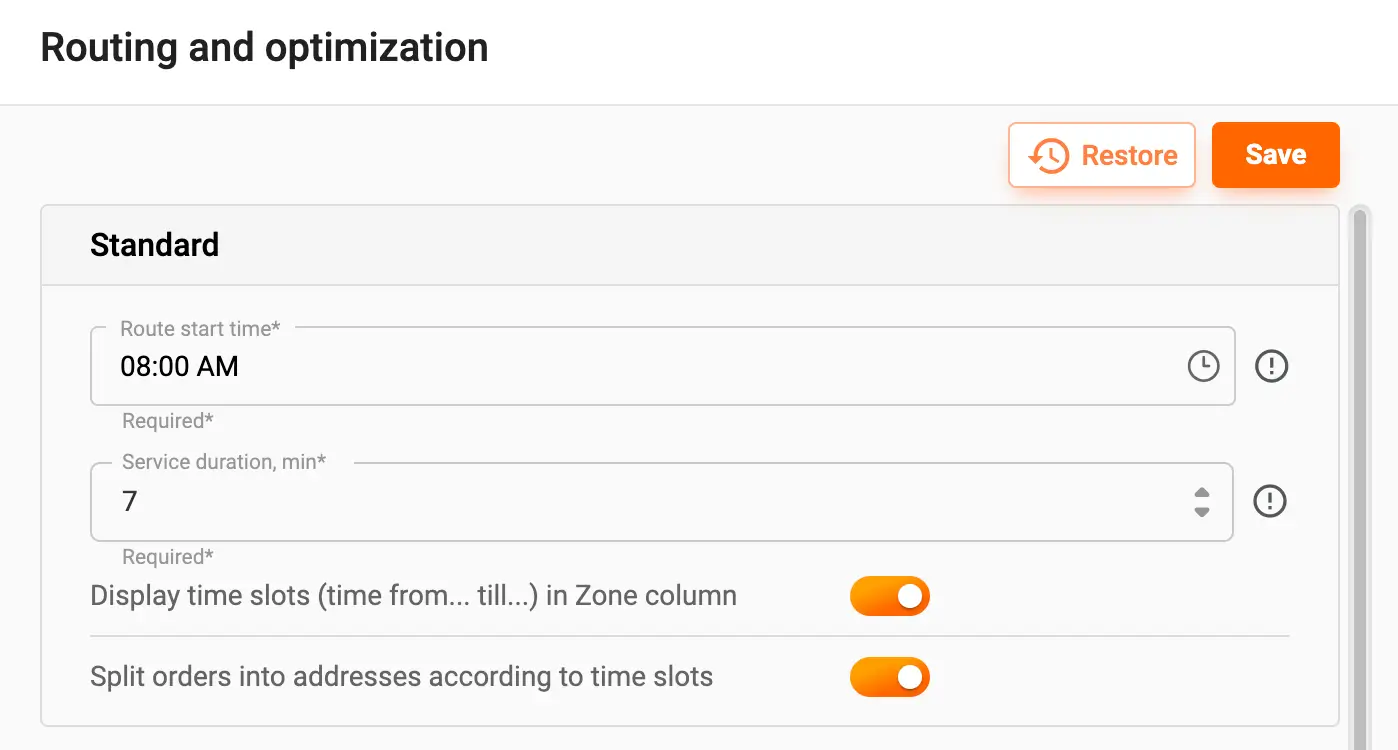
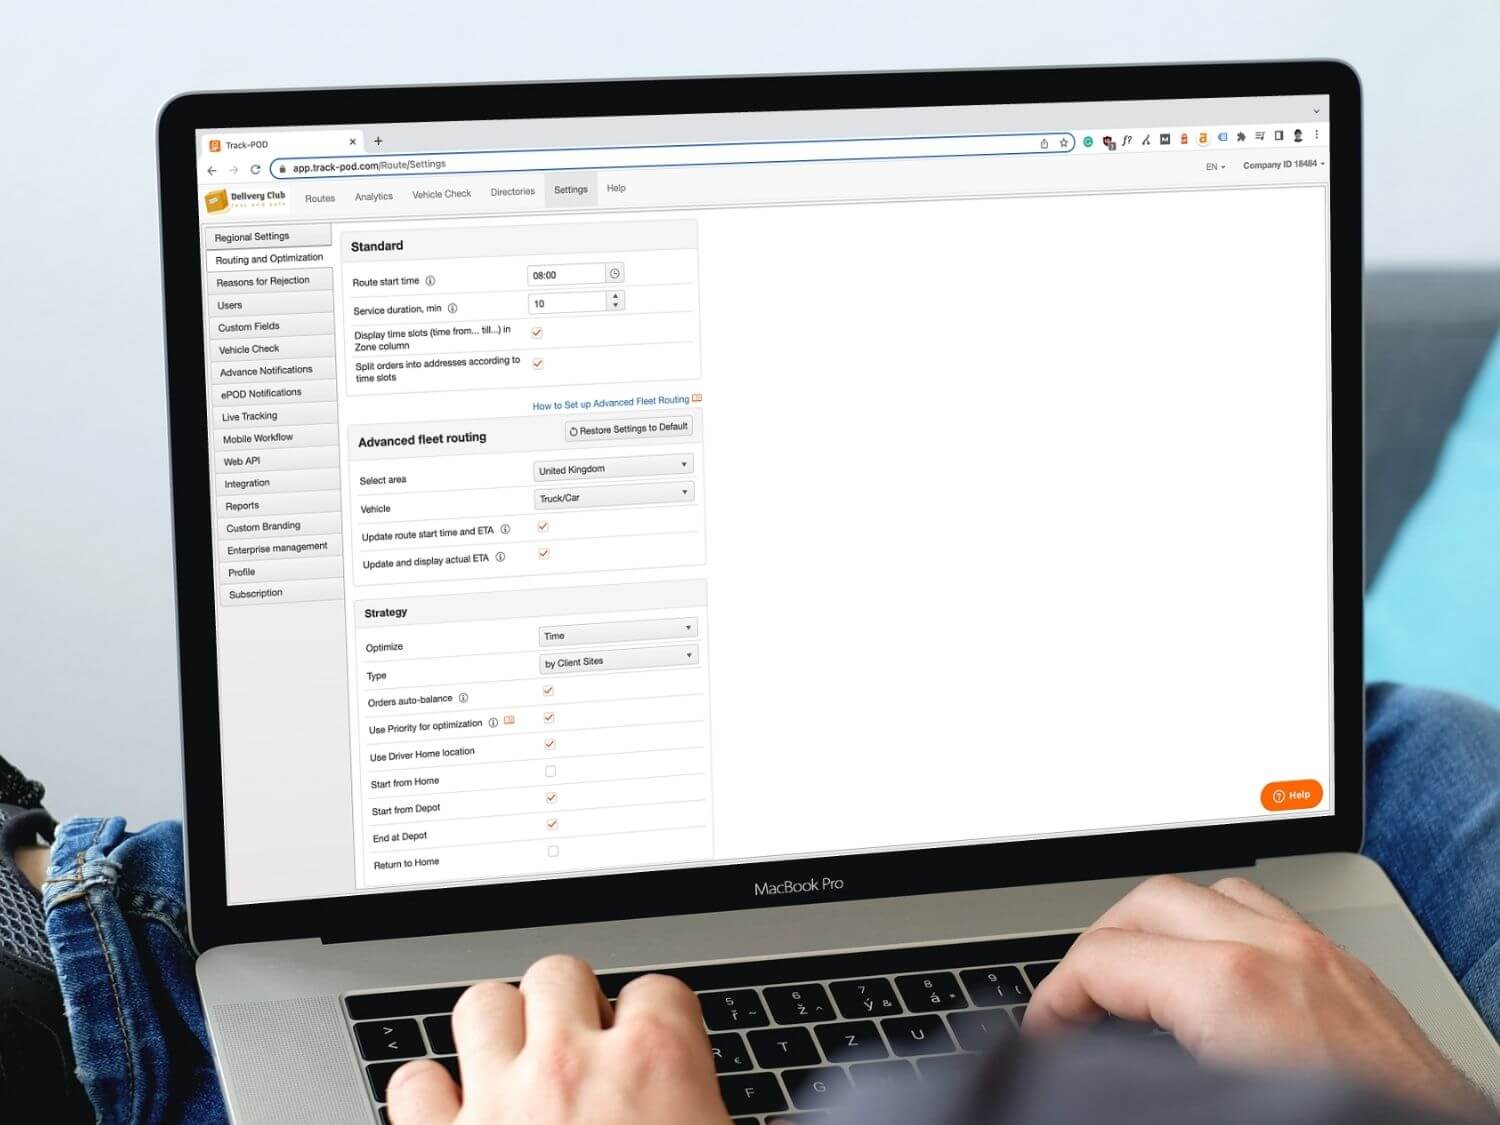
Based on your actual average service time, you can adjust your routing & optimization settings for more precise calculations.
Reasons for rejection offers a wealth of qualitative insights into your logistics performance. In addition to knowing how many of your orders were delivered partially, you get to explore the reasons behind rejected items.
In Track-POD Analytics 2.0, you can see a breakdown into reasons for rejection of orders as well as goods.
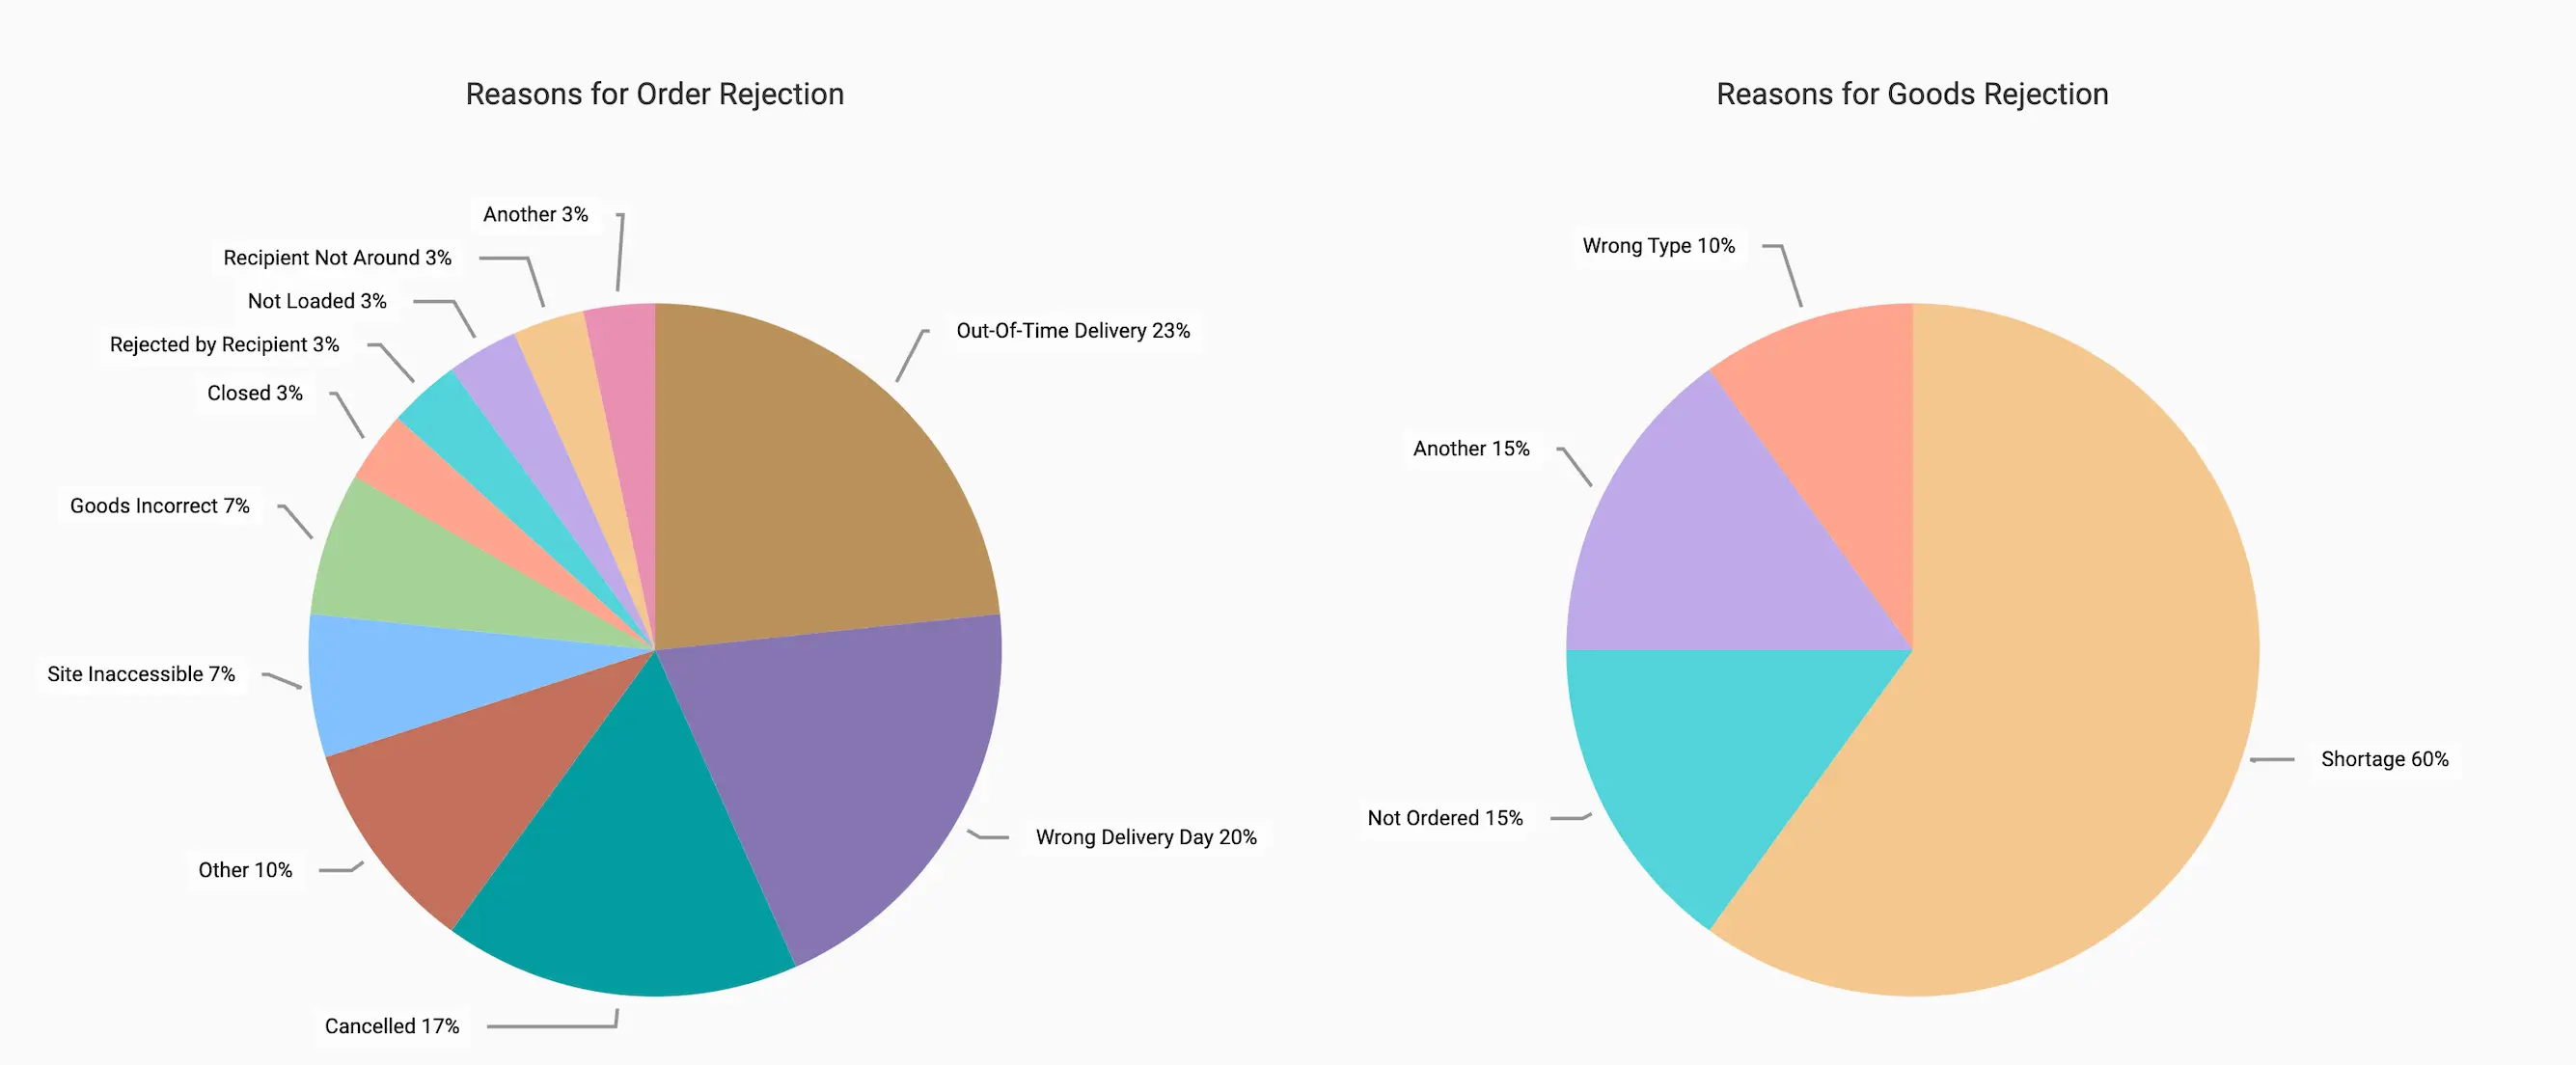
Needless to say, this kind of data will inform your future route planning, load planning, and delivery confirmation processes.
Unused or poorly optimized vehicle space is one of the most popular gaps in last-mile delivery planning. This is the whole point behind multi-stop routing - to make sure no resources are wasted, including truck resources.
Track-POD allows you to gain insight into fleet capacity utilization for each of your vehicles.
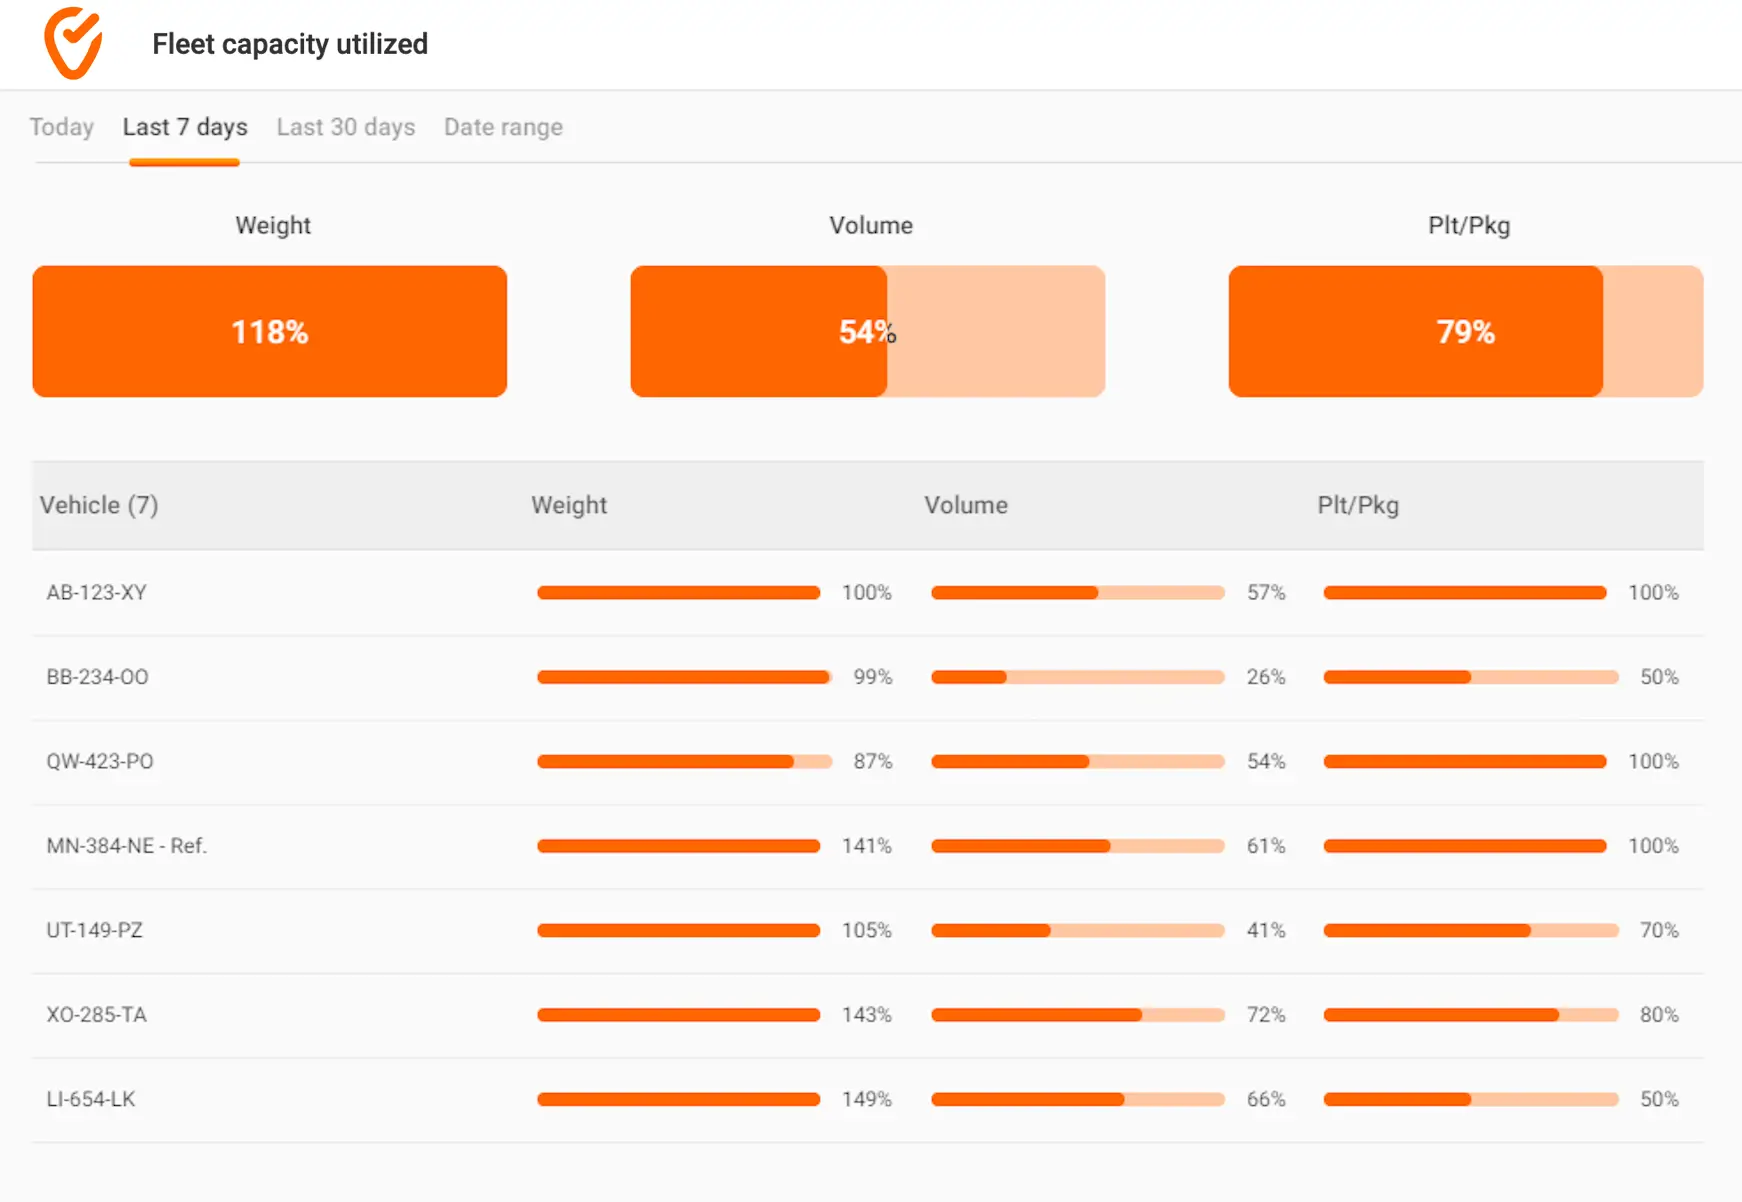
Once you know which of your trucks have been under- or over-used, you can make better load planning and delivery planning decisions.
Among the built-in reports available in Track-POD analytics, you can find Cost Savings by Time/Distance.
This report is meant to show how much money you saved with route optimization depending on how your drivers' planned vs actual distance and time compare.
Cost Savings by Time/Distance report is available for all depots or any one of your depots so you can segregate data and analyze it at the depot level.
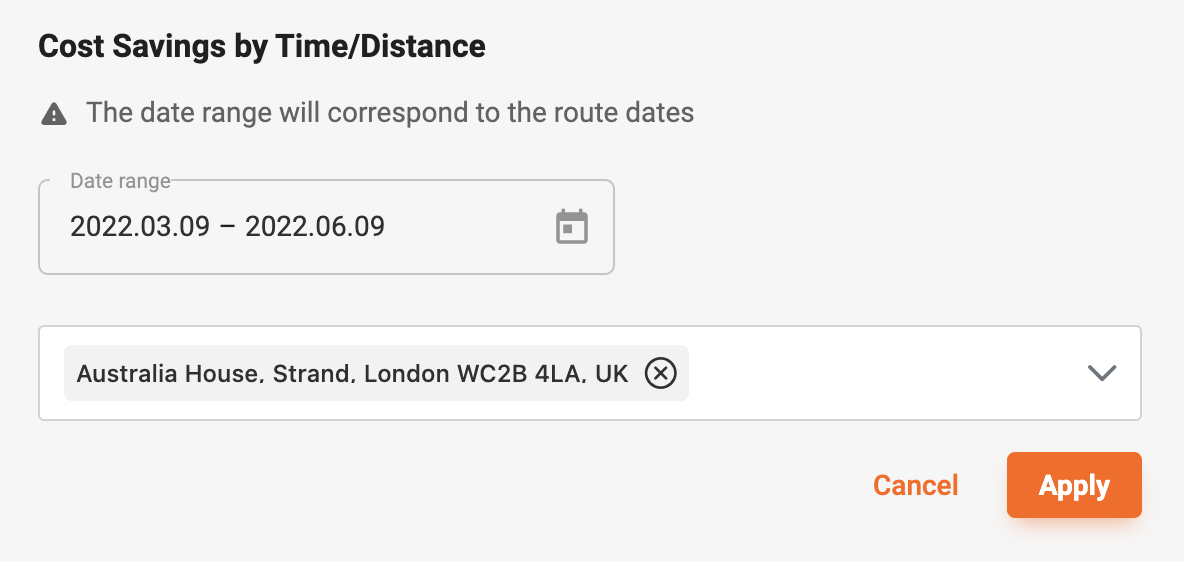
Once you've downloaded the Cost Savings by Time/Distance report in the new version of Track-POD analytics, you'll see a breakdown per driver.
The data points for cost savings calculation is # routes, #stops, planned vs actual distance, and planned vs actual time.
If you're interested in the same analytics but without the insights into cost savings, you can access it in your Track-POD Route Manager app for Android.
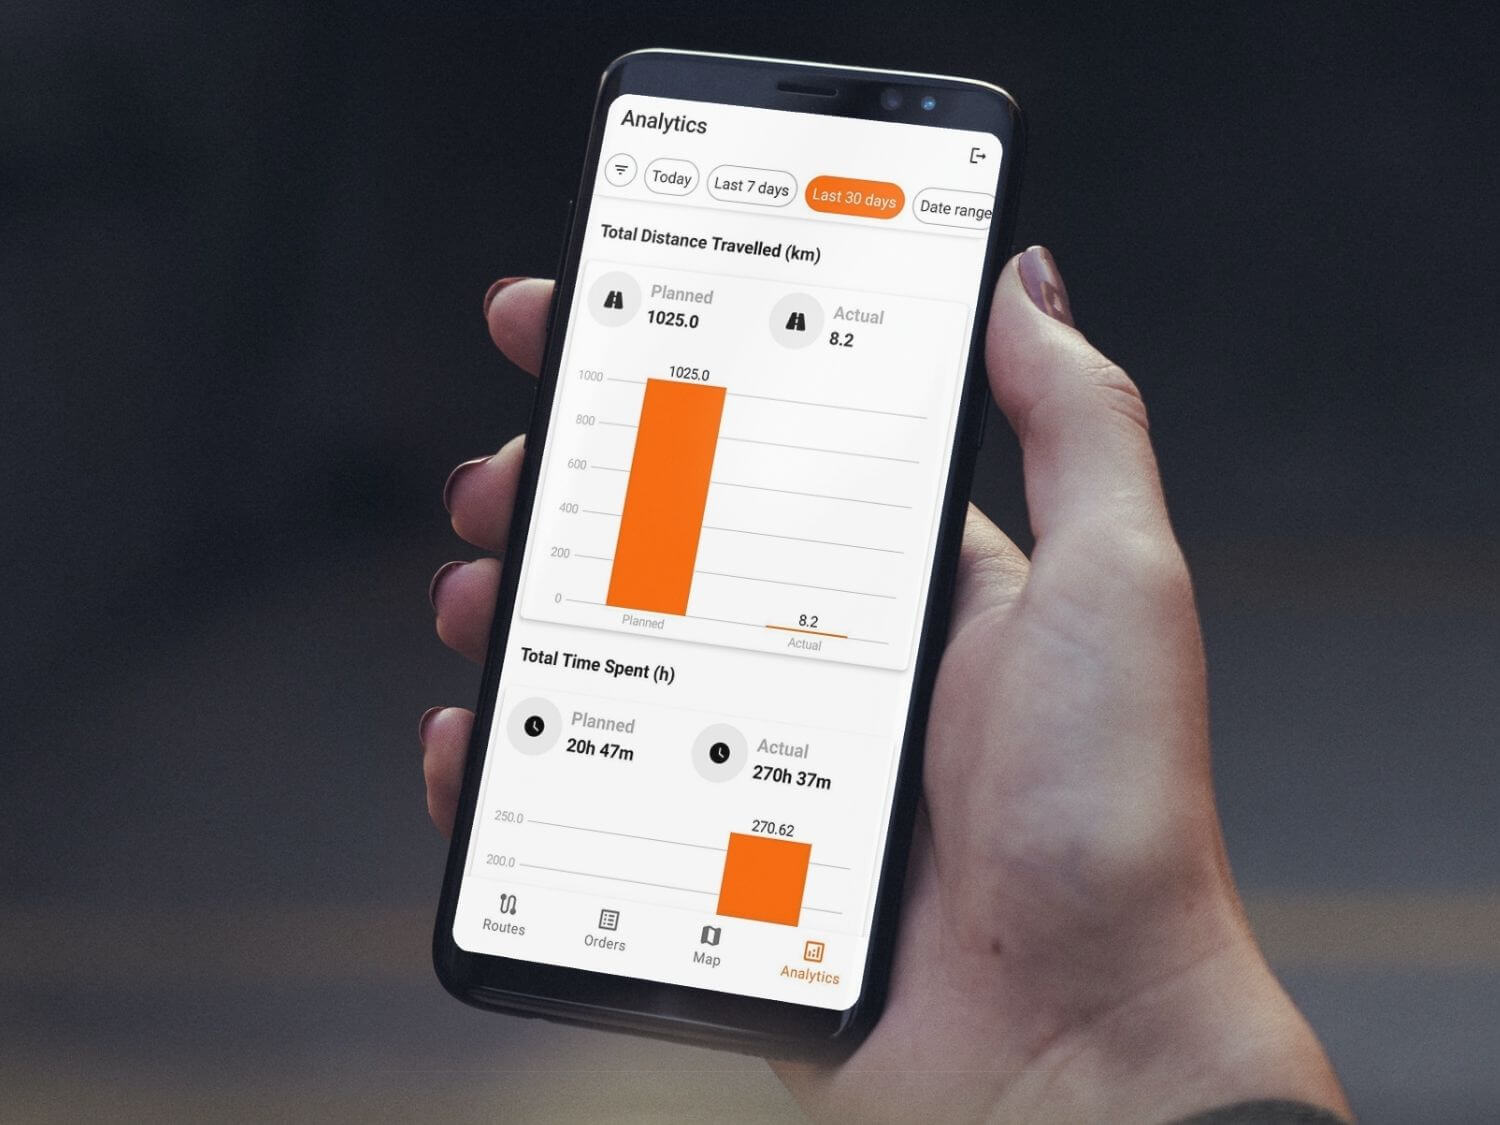
Planned vs actual distance is exactly what it sounds like. On the one hand, you have the distance planned by the system. Depending on whether you use the Track-POD route optimization algorithm or not, your planned times will vary.
On the other hand, you have your actual distance, i.e. what the driver traveled based on GPS tracking enabled via the Track-POD delivery driver app.
Planned vs actual time insights work in the same way.
When you plan delivery routes with Track-POD, the system calculates how much time it will take to complete routes based on how long it takes the drivers to get to each site in the route, how long it takes to carry out the delivery service, as well as drivers' break time.

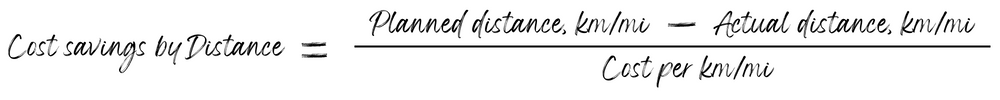
By assessing the difference between the planned and actual time it took your drivers to complete delivery routes, together with your route rates, Track-POD can calculate how much money you've saved or lost.
Now, based on how your planned and actual distance/time compare and how significant your cost savings are, you can make better routing decisions.
Delivery operations need to rely on performance data. When you have reliable historical data, you can maximize the usage of route optimization algorithms and AI.
Predictive analytics in route planning is how you get consistently better with route planning. I hope this post gives you an overview of what kind of data you can retrieve from Track-POD to make the most of logistics planning and optimization.
If you'd like to know how you can boost your efficiency with Track-POD delivery software, book a free demo and we'll give you a personalized tour.
Discover key features and top picks for wholesale distribution software in 2026 to streamline operations and adapt to a rapidly evolving market.
Read More
If you’re in the business of making or selling furniture, you know how essential it is to deliver furniture on time, in full, at the correct address, and undamaged. Learn all you need to know about furniture delivery software.
Read More
If you are considering starting a last-mile delivery business, this article is for you. Keep reading and find useful information written in a step-by-step guidance format on how to start a last-mile delivery business.
Read More