17 Fleet Management Metrics that Can Make or Break Your Last Mile Success

by
Alina Kostukova
August 30, 2023
Data democratization makes analytics tools available to all businesses. So, failing to use performance metrics in 2023 means falling far behind the competition.
We've already covered Cost Per Mile (CPM) and other essential delivery KPIs you need to employ to make data-driven decisions.
This time, we will break down another essential category of logistics KPIs - fleet metrics.
We will discuss 17 crucial metrics your business should evaluate to optimize fleet, set realistic benchmarks, and scale in no time.
What is fleet management?
Let's cover the basics before diving into the key fleet metrics.
Fleet management involves overseeing and controlling a company's fleet capacity.
Fleet managers control the entire fleet vehicle lifecycle, from procurement and scheduling to monitoring and maintenance.
Technology and data-driven strategies are at the heart of fleet management.
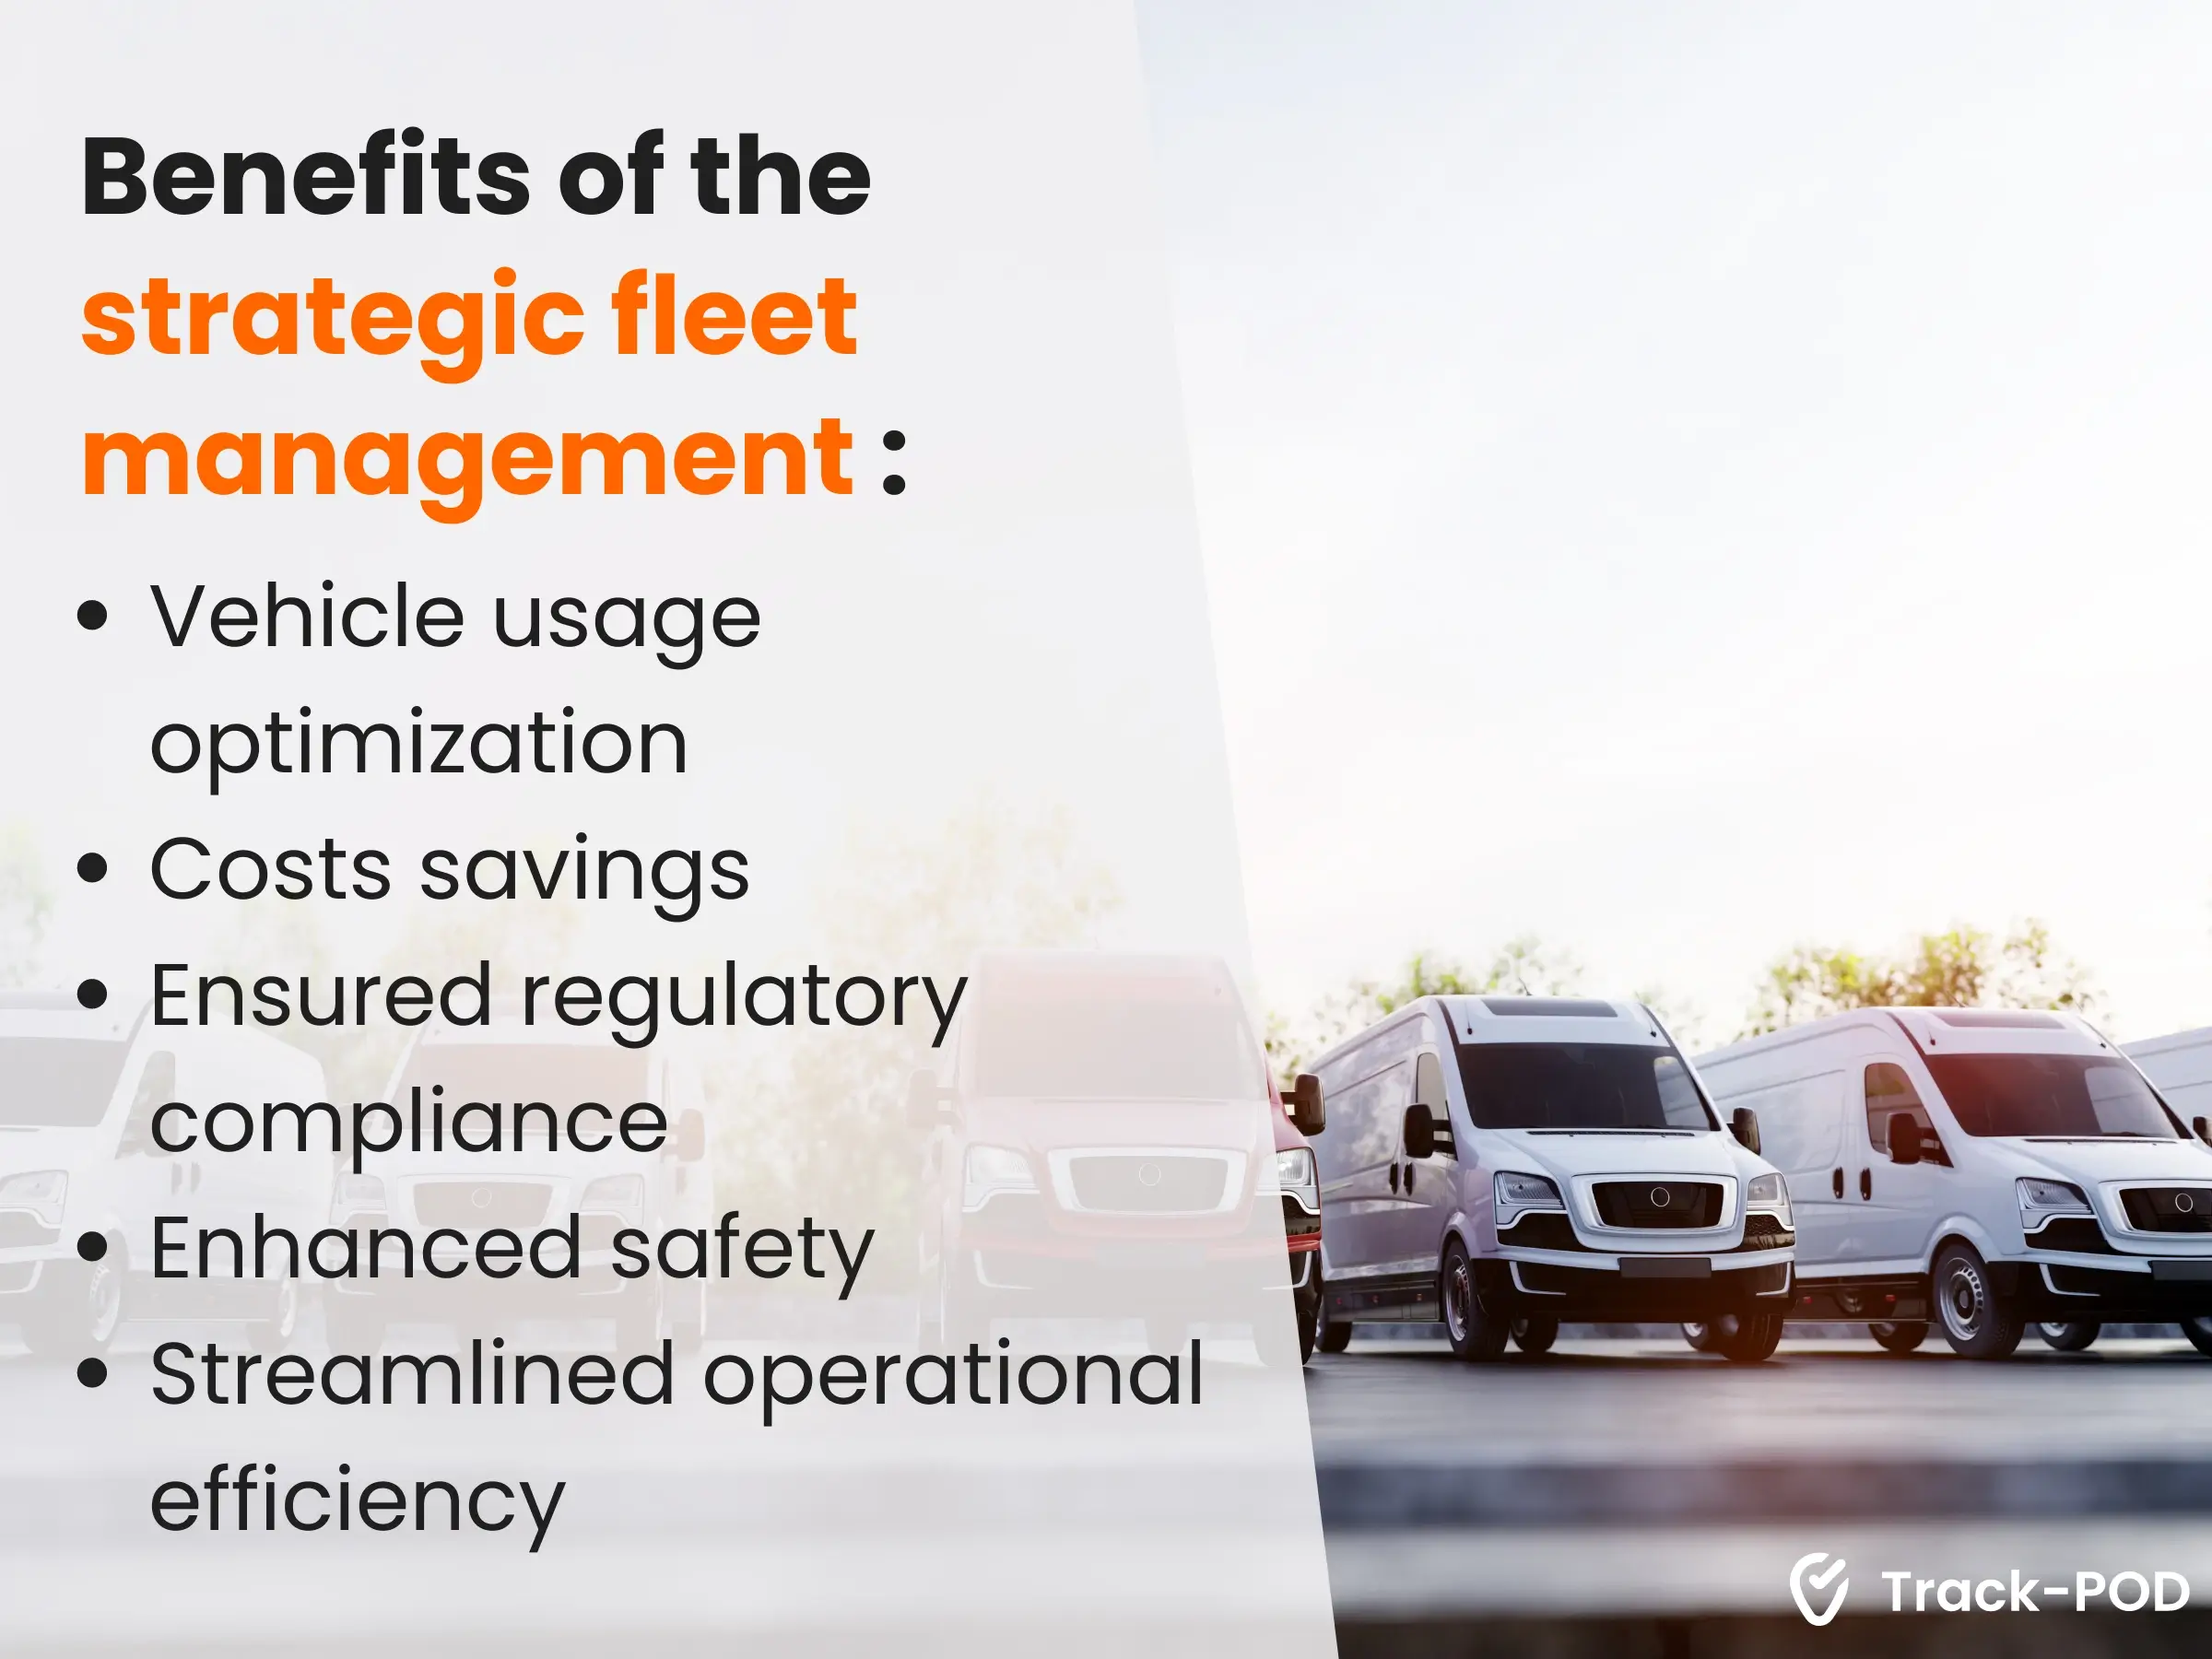
Strategic fleet management can ultimately bring the following benefits:
- Vehicle usage optimization;
- Logistics costs savings;
- Ensured regulatory compliance;
- Enhanced safety;
- Streamlined operational efficiency.
Fleet management software
Fleet management software is a comprehensive solution businesses and organizations use to efficiently manage their fleet of vehicles.
It encompasses various functions, including vehicle tracking, maintenance scheduling, fuel management, driver performance monitoring, and data analytics.
This category software can be integrated with transportation management systems for enhanced efficiency.
Fleet performance metrics
There are numerous metrics that fleet managers can use to evaluate and optimize last mile operations.
Let's discuss the most crucial fleet performance indicators that can help to lower operational costs and simplify delivery planning.
Fuel efficiency metrics
This category of fleet KPIs is used to evaluate how efficiently vehicles utilize fuel resources.
These metrics help assess and compare the performance of various trucks in terms of fuel consumption and environmental impact.
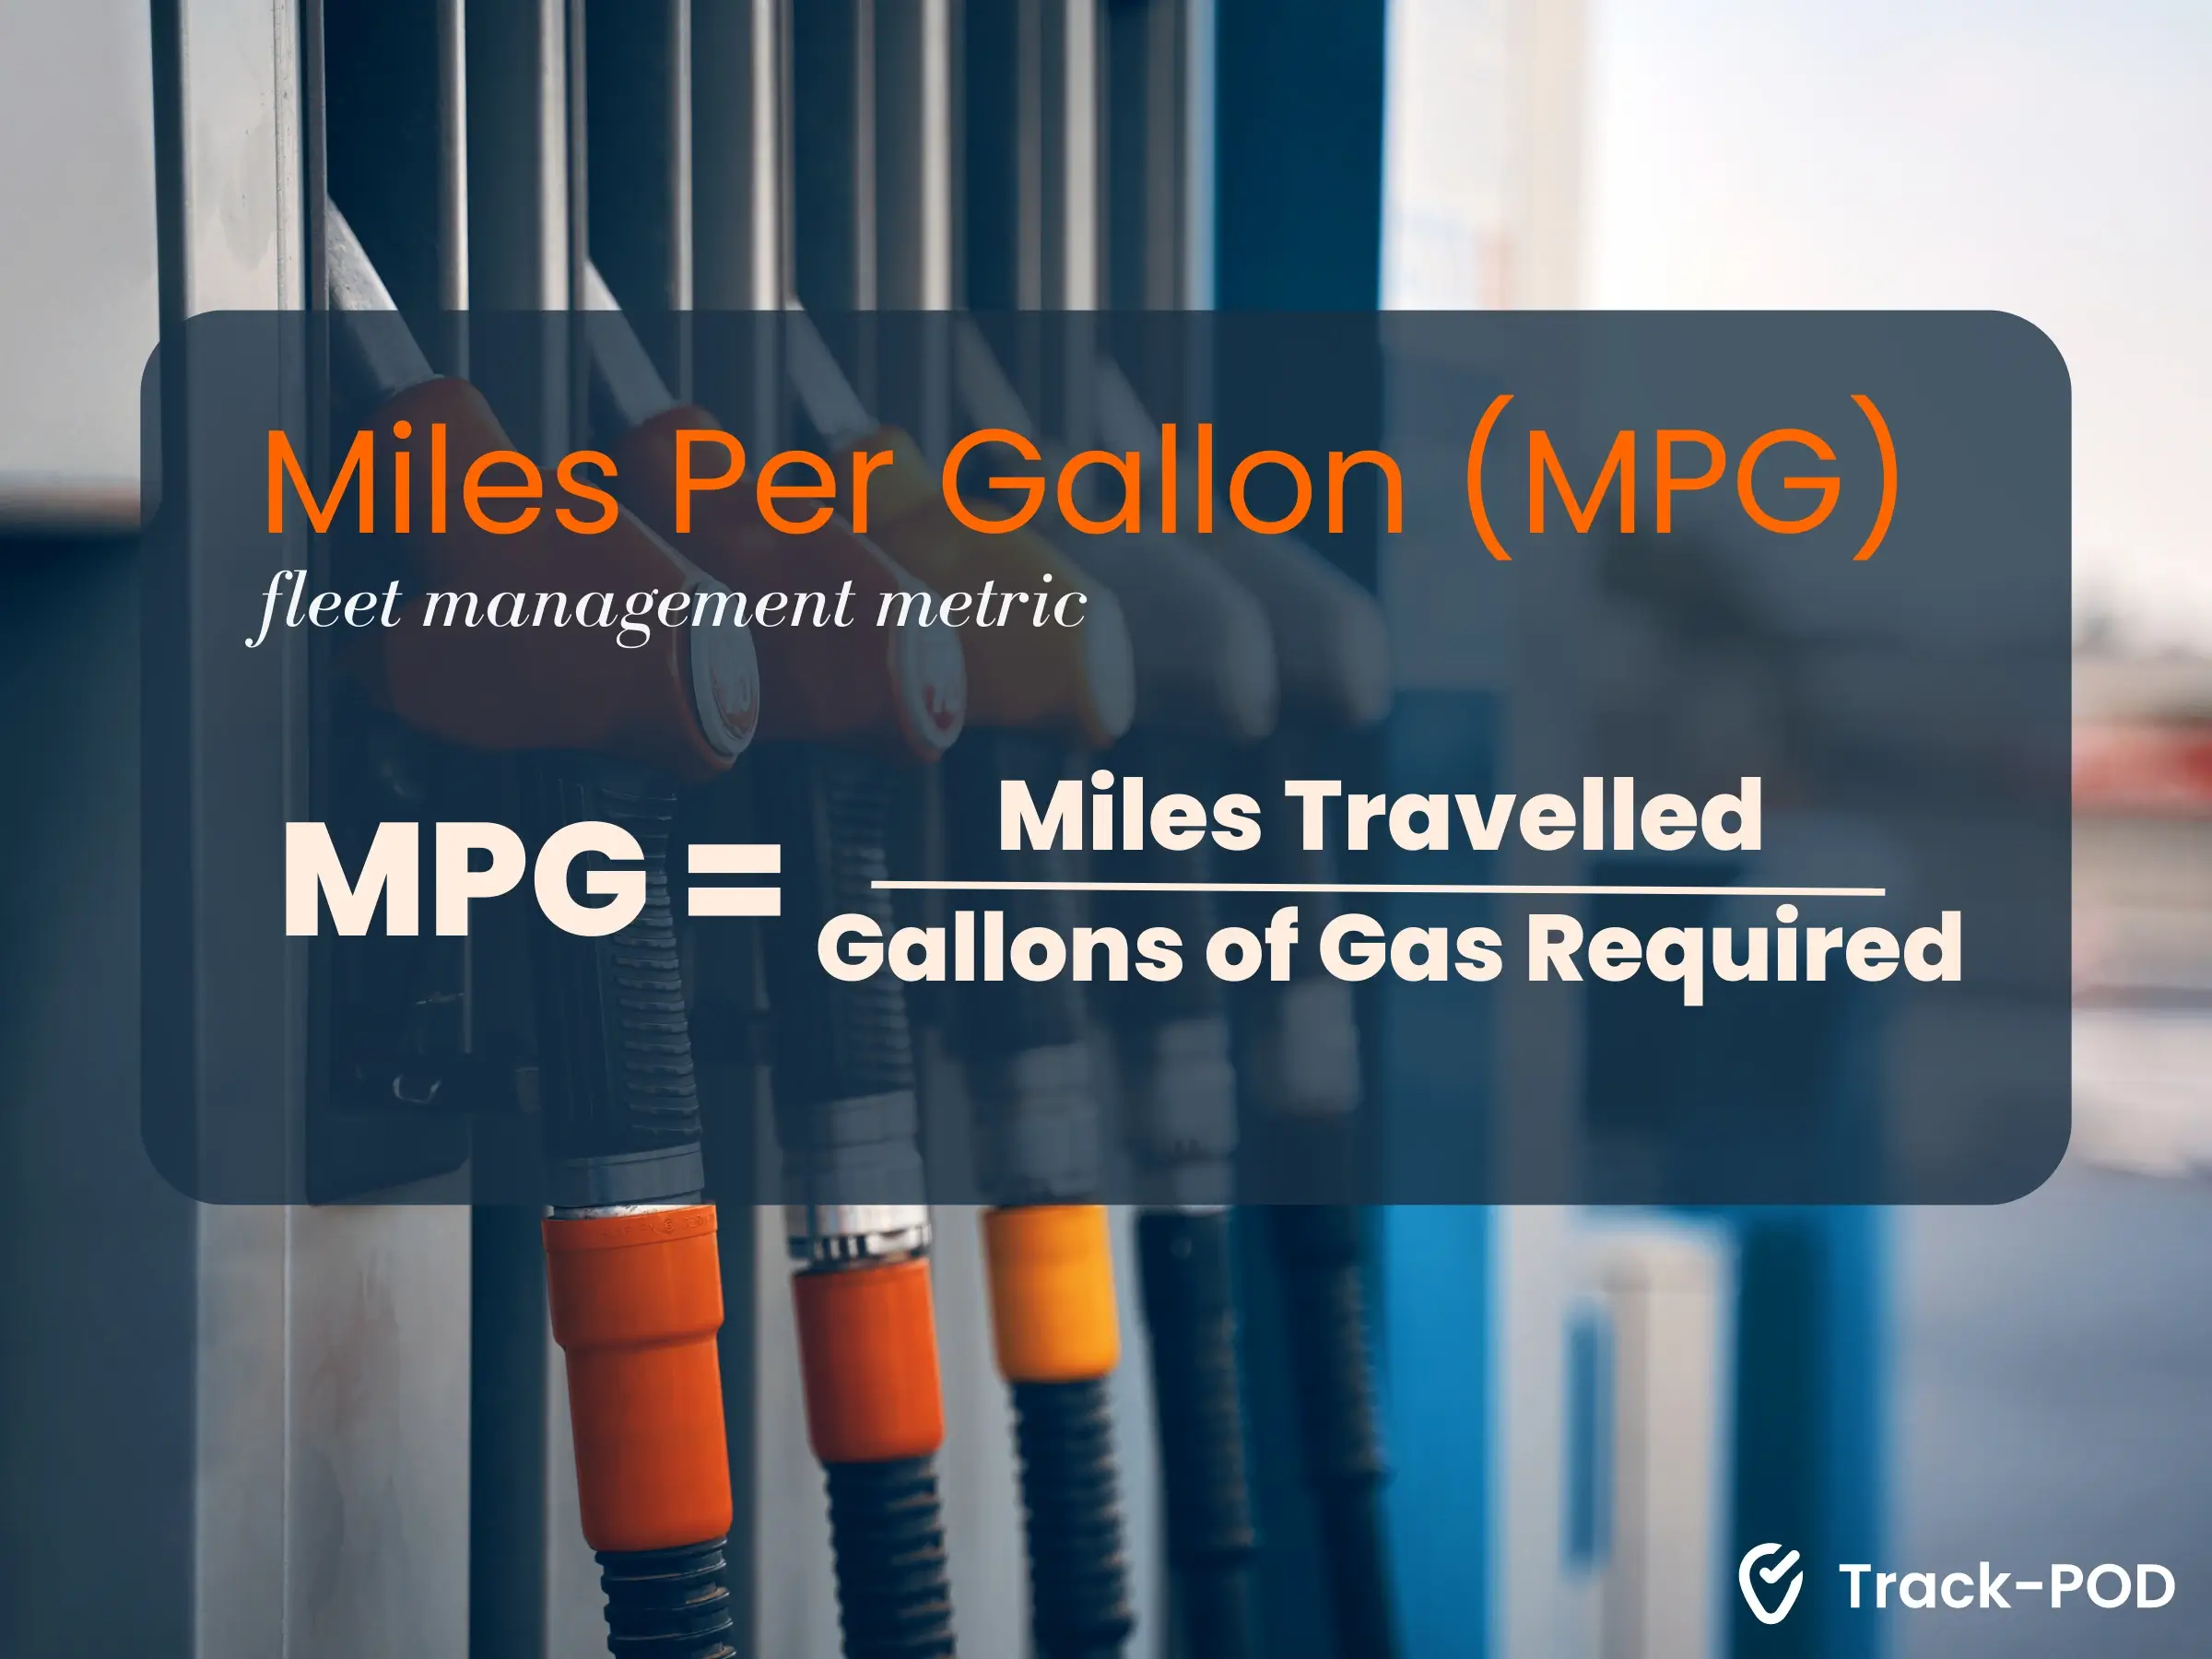
Miles per gallon (MPG)
This fuel indicator measures the distance a vehicle can travel per gallon of fuel.
It lets fleet managers easily evaluate vehicle fuel efficiency to make educated vehicle procurement.
The quickest approach for calculating gas mileage is to divide the miles traveled by the gallons of gas your vehicle requires to refuel:
Miles Per Gallon = Miles Travelled / Gallons of Gas Required
Liters per 100 kilometers (L/100km)
Unlike MPG, this fleet performance indicator is standard in countries using the metric system.
It simply measures the liters of fuel a vehicle uses to drive 100 km.
To calculate Liters per 100 Kilometers (L/100km), you need to know the amount of fuel consumed (in liters) and the distance traveled (in kilometers).
The formula for calculating L/100km is fairly straightforward:
L/100km = (Fuel Consumption (L) / Distance Traveled (km)) * 100
Fleet maintenance metrics
Fleet maintenance metrics are used to track, assess, and optimize the maintenance operations of a company's vehicle fleet.
This fleet data can provide insights into the health and performance of vehicles.
Preventive maintenance compliance (PMC)
This fleet metric tracks the percentage of vehicles that receive scheduled preventive maintenance on time.
The metric is typically expressed as a percentage and is calculated using the following formula:
PMC = (Number of Vehicles with Completed Maintenance / Total Number of Vehicles) * 100%
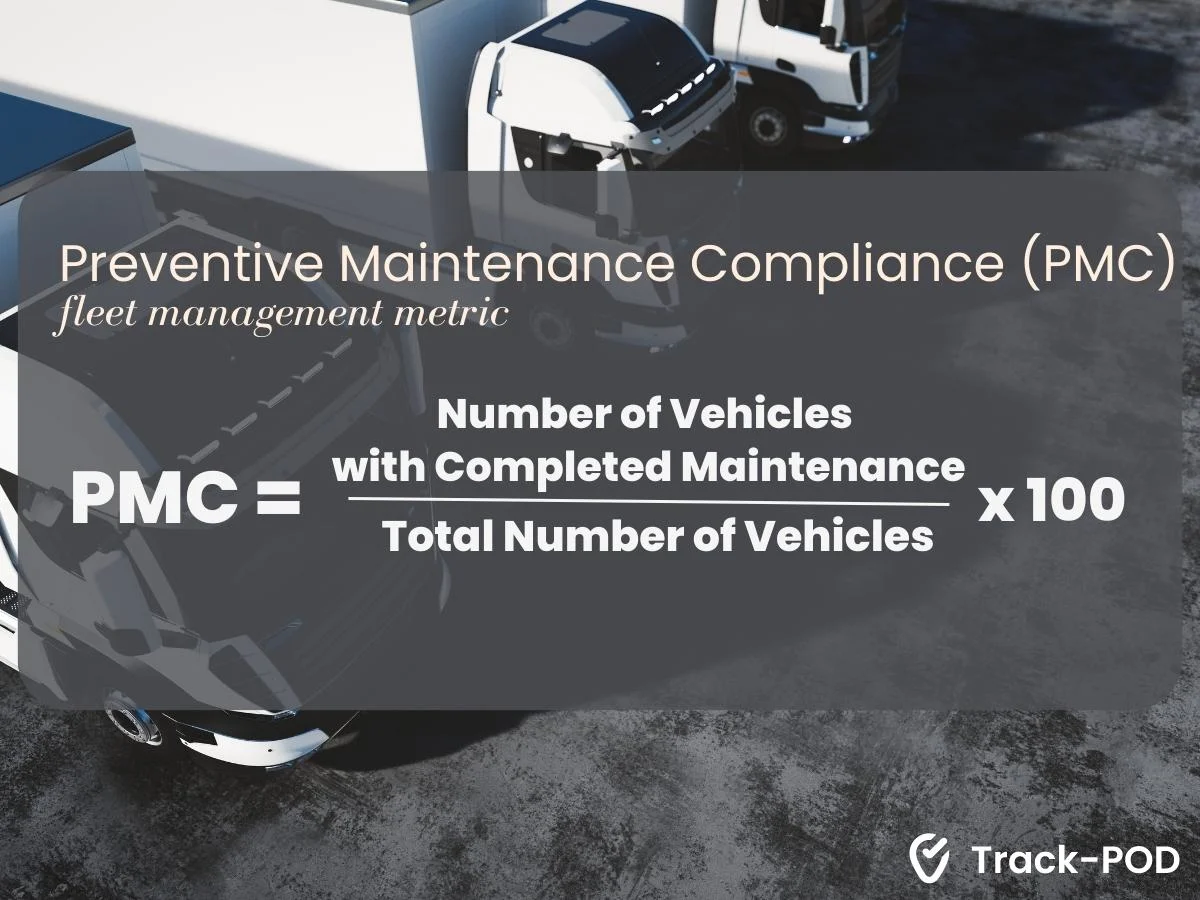
Preventive maintenance compliance ensures that vehicles are regularly inspected and serviced to prevent breakdowns and costly repairs.
Mean time between failures (MTBF)
MTBF metric measures the average time a vehicle operates before experiencing a breakdown.
Measuring Mean Time Between Failures (MTBF) for fleet management involves collecting data on the operational time of vehicles in the fleet and the occurrences of failures.
Below is the formula to measure MTBF:
MTBF = Total Operational Time / Number of Failures
Maintenance cost per mile/kilometer
Calculates the cost of maintenance for each unit of distance traveled.
The formula to calculate Maintenance Cost per Mile/Kilometer is:
Maintenance Cost per Mile/Km = Total Maintenance Costs / Total Distance Traveled
This metric is a valuable tool for fleet managers and organizations to assess the cost-effectiveness and overall health of the fleet.
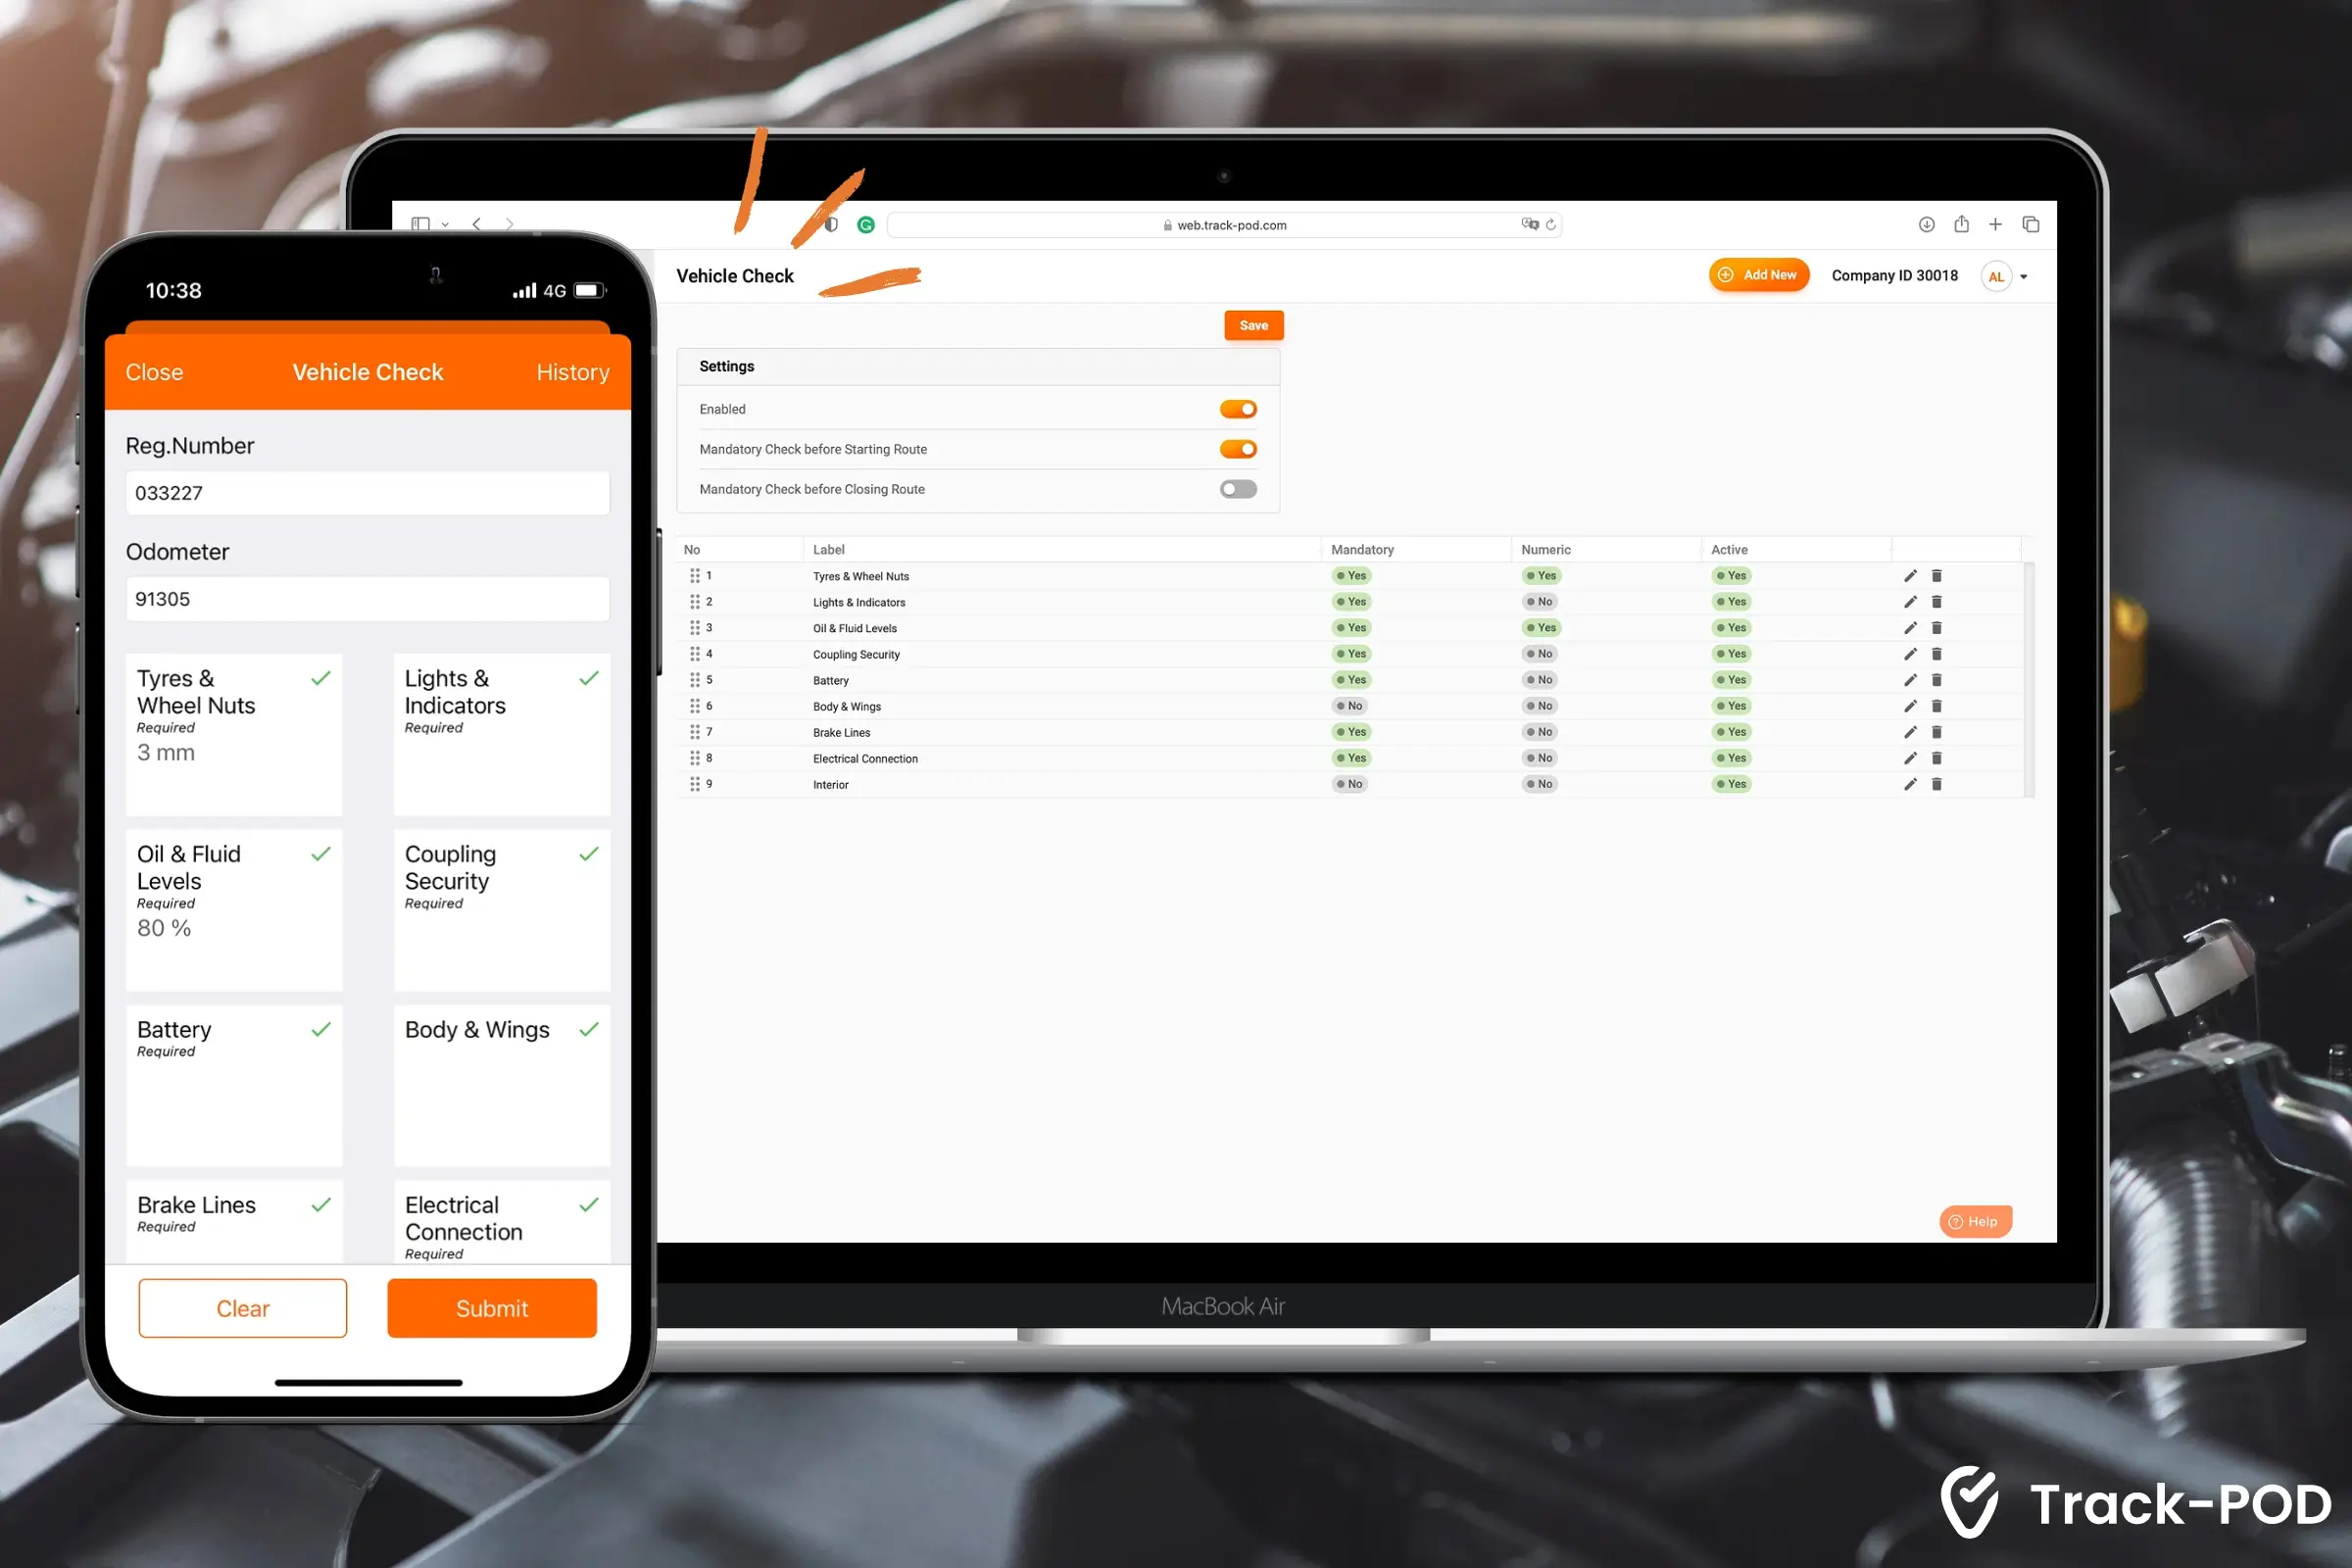
Pro tip: Use the "Vehicle Check" feature in Track-POD's web dashboard to have drivers report on the vehicle's health before each route. It enables you to monitor your fleet's technical status and plan for preventative maintenance ahead of time through custom safety checklists.
Fleet utilization metrics
Fleet utilization metrics are essential for the evaluation and management of existing vehicles. Tracking these fleet performance indicators helps in short and long-term planning.
Vehicle downtime
Measures the amount of time a vehicle is unavailable for use due to maintenance, repairs, or other reasons.
To calculate this metric, determine the vehicle's downtime start and finish timings. Downtime might happen due to maintenance, repairs, breakdowns, planned maintenance, or any other vehicle non-operation.
Next, subtract the start time from the end time to calculate the duration of the downtime in hours or minutes:
Downtime Duration = End Time - Start Time
Vehicle downtime metric serves as a key indicator of operational effectiveness, resource management, and cost control within a fleet management context.
Idle time
Idling is a serious concern for business logistics, as it leads to wasted time and resources.
This fleet performance indicator tracks how long a vehicle's engine is running while the truck is stationary.
The calculator formula of this metric is fairly simple:
Idle Time Duration = Idle End Time - Idle Start Time
This metric provides valuable insight into fleet and driver performance and helps use company resources more efficiently.
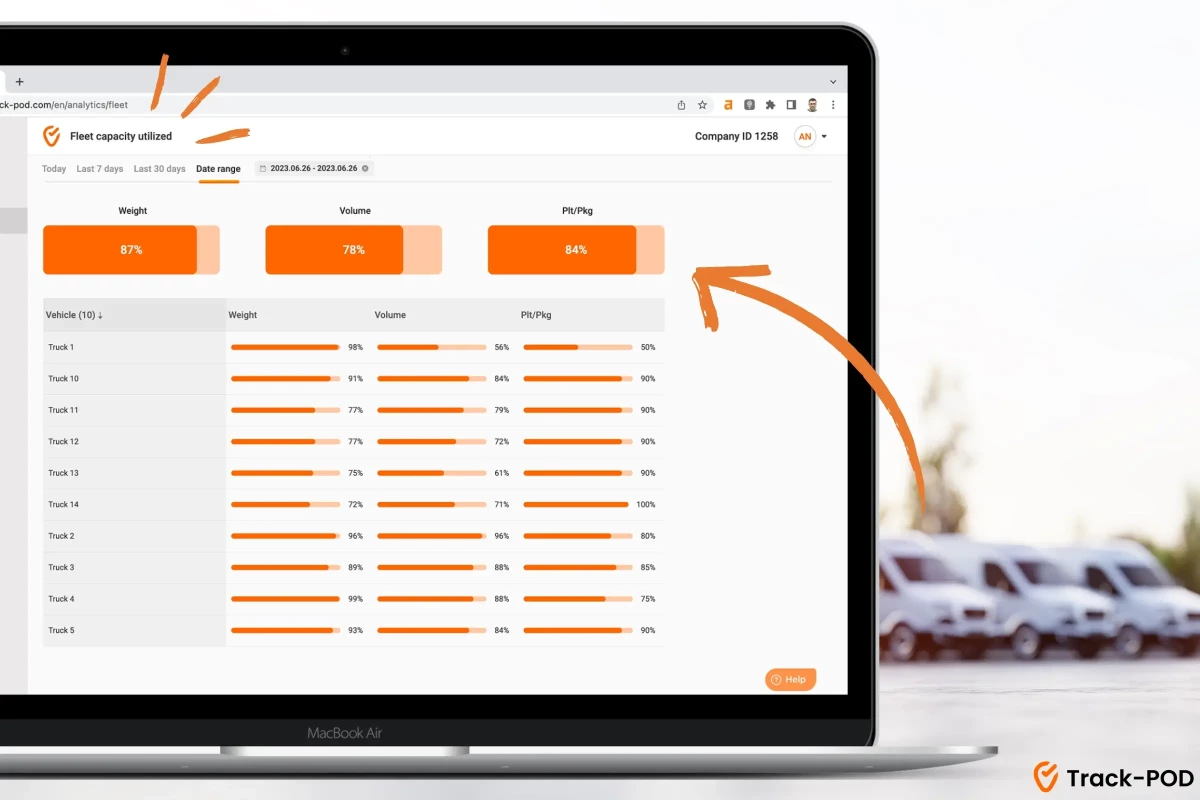
Vehicle utilization rate
Vehicle utilization rate is one of the most crucial fleet management KPIs.
This indicator measures the percentage of time a vehicle is actively used compared to its available time.
To calculate the vehicle utilization rate, you can use the following formula:
Vehicle Utilization Rate = (Total Hours the Vehicle was in Use / Total Available Hours) * 100
Pro tip: In Track-POD, you can check the “Fleet capacity utilized” report to evaluate the utilized weight, volume, and Plt/Pkg metrics—all inside of your last mile software dashboard.

Fleet safety metrics
When managing deliveries, ensuring your fleet is safe should be one of your top concerns.
This group of fleet performance data helps to find potential and actual safety risks and develop new ways to avoid dangerous situations.
Accident rate
The vehicle accident rate metric calculates the number of accidents per vehicle or miles/kilometers traveled.
To determine this vital indicator, you can use the following formula:
Accident Rate = (Total Number of Accidents / Total Distance Traveled) * Multiplier
This performance indicator will help to identify and replace potentially malfunctioning cars. It will also help identify patterns associated with certain drivers or routes.
Driver behavior score
This fleet metric evaluates driver performance in terms of harsh braking, acceleration, speeding, etc.
Calculating a driver behavior score typically involves assigning a numerical value to different aspects of driving behavior. These values are then averaged to generate an overall score.
If your fleet managers notice any dangerous habits among your drivers, you can set up safety training programs to fix the problem.
Fleet costs metrics
Fleet cost metrics provide insights into a vehicle fleet's financial health and operational efficiency.
These metrics allow organizations to make informed decisions and optimize resource allocation.
After all, the fleet costs constitute a significant factor in the logistics budget.
Total cost of ownership (TCO)
TCO metric provides a holistic view of all costs associated with owning, operating, and maintaining a fleet of vehicles throughout their entire lifecycle.
To calculate this helpful metric, sum all costs associated with owning and operating a vehicle, including acquisition, maintenance, fuel, insurance, etc.
TCO is critical for careful financial planning and decision-making in the future.
Depreciation rate
The depreciation rate measures the decrease in vehicle value over time.
To determine this metric, for each vehicle, subtract its current value from its initial purchase cost to find the total depreciation amount:
Depreciation Rate= Total Depreciation / Initial Purchase Cost
Vehicle depreciation rate can influence financial decisions, impact long-term costs, and guide new vehicle management strategies.
Pro tip: Track-POD’s analytic dashboard provides you with Driver Statistics, Trip Summary by Routes, Cost Saving Time/Distance and other useful shipping reports to help you analyze your fleet metrics.
Environmental metrics
Green logistics practices have emerged as a new industry standard that is critical for customers and businesses.
You can calculate your actual green logistics metrics to analyze your company's environmental impact and apply new eco-friendly practices.
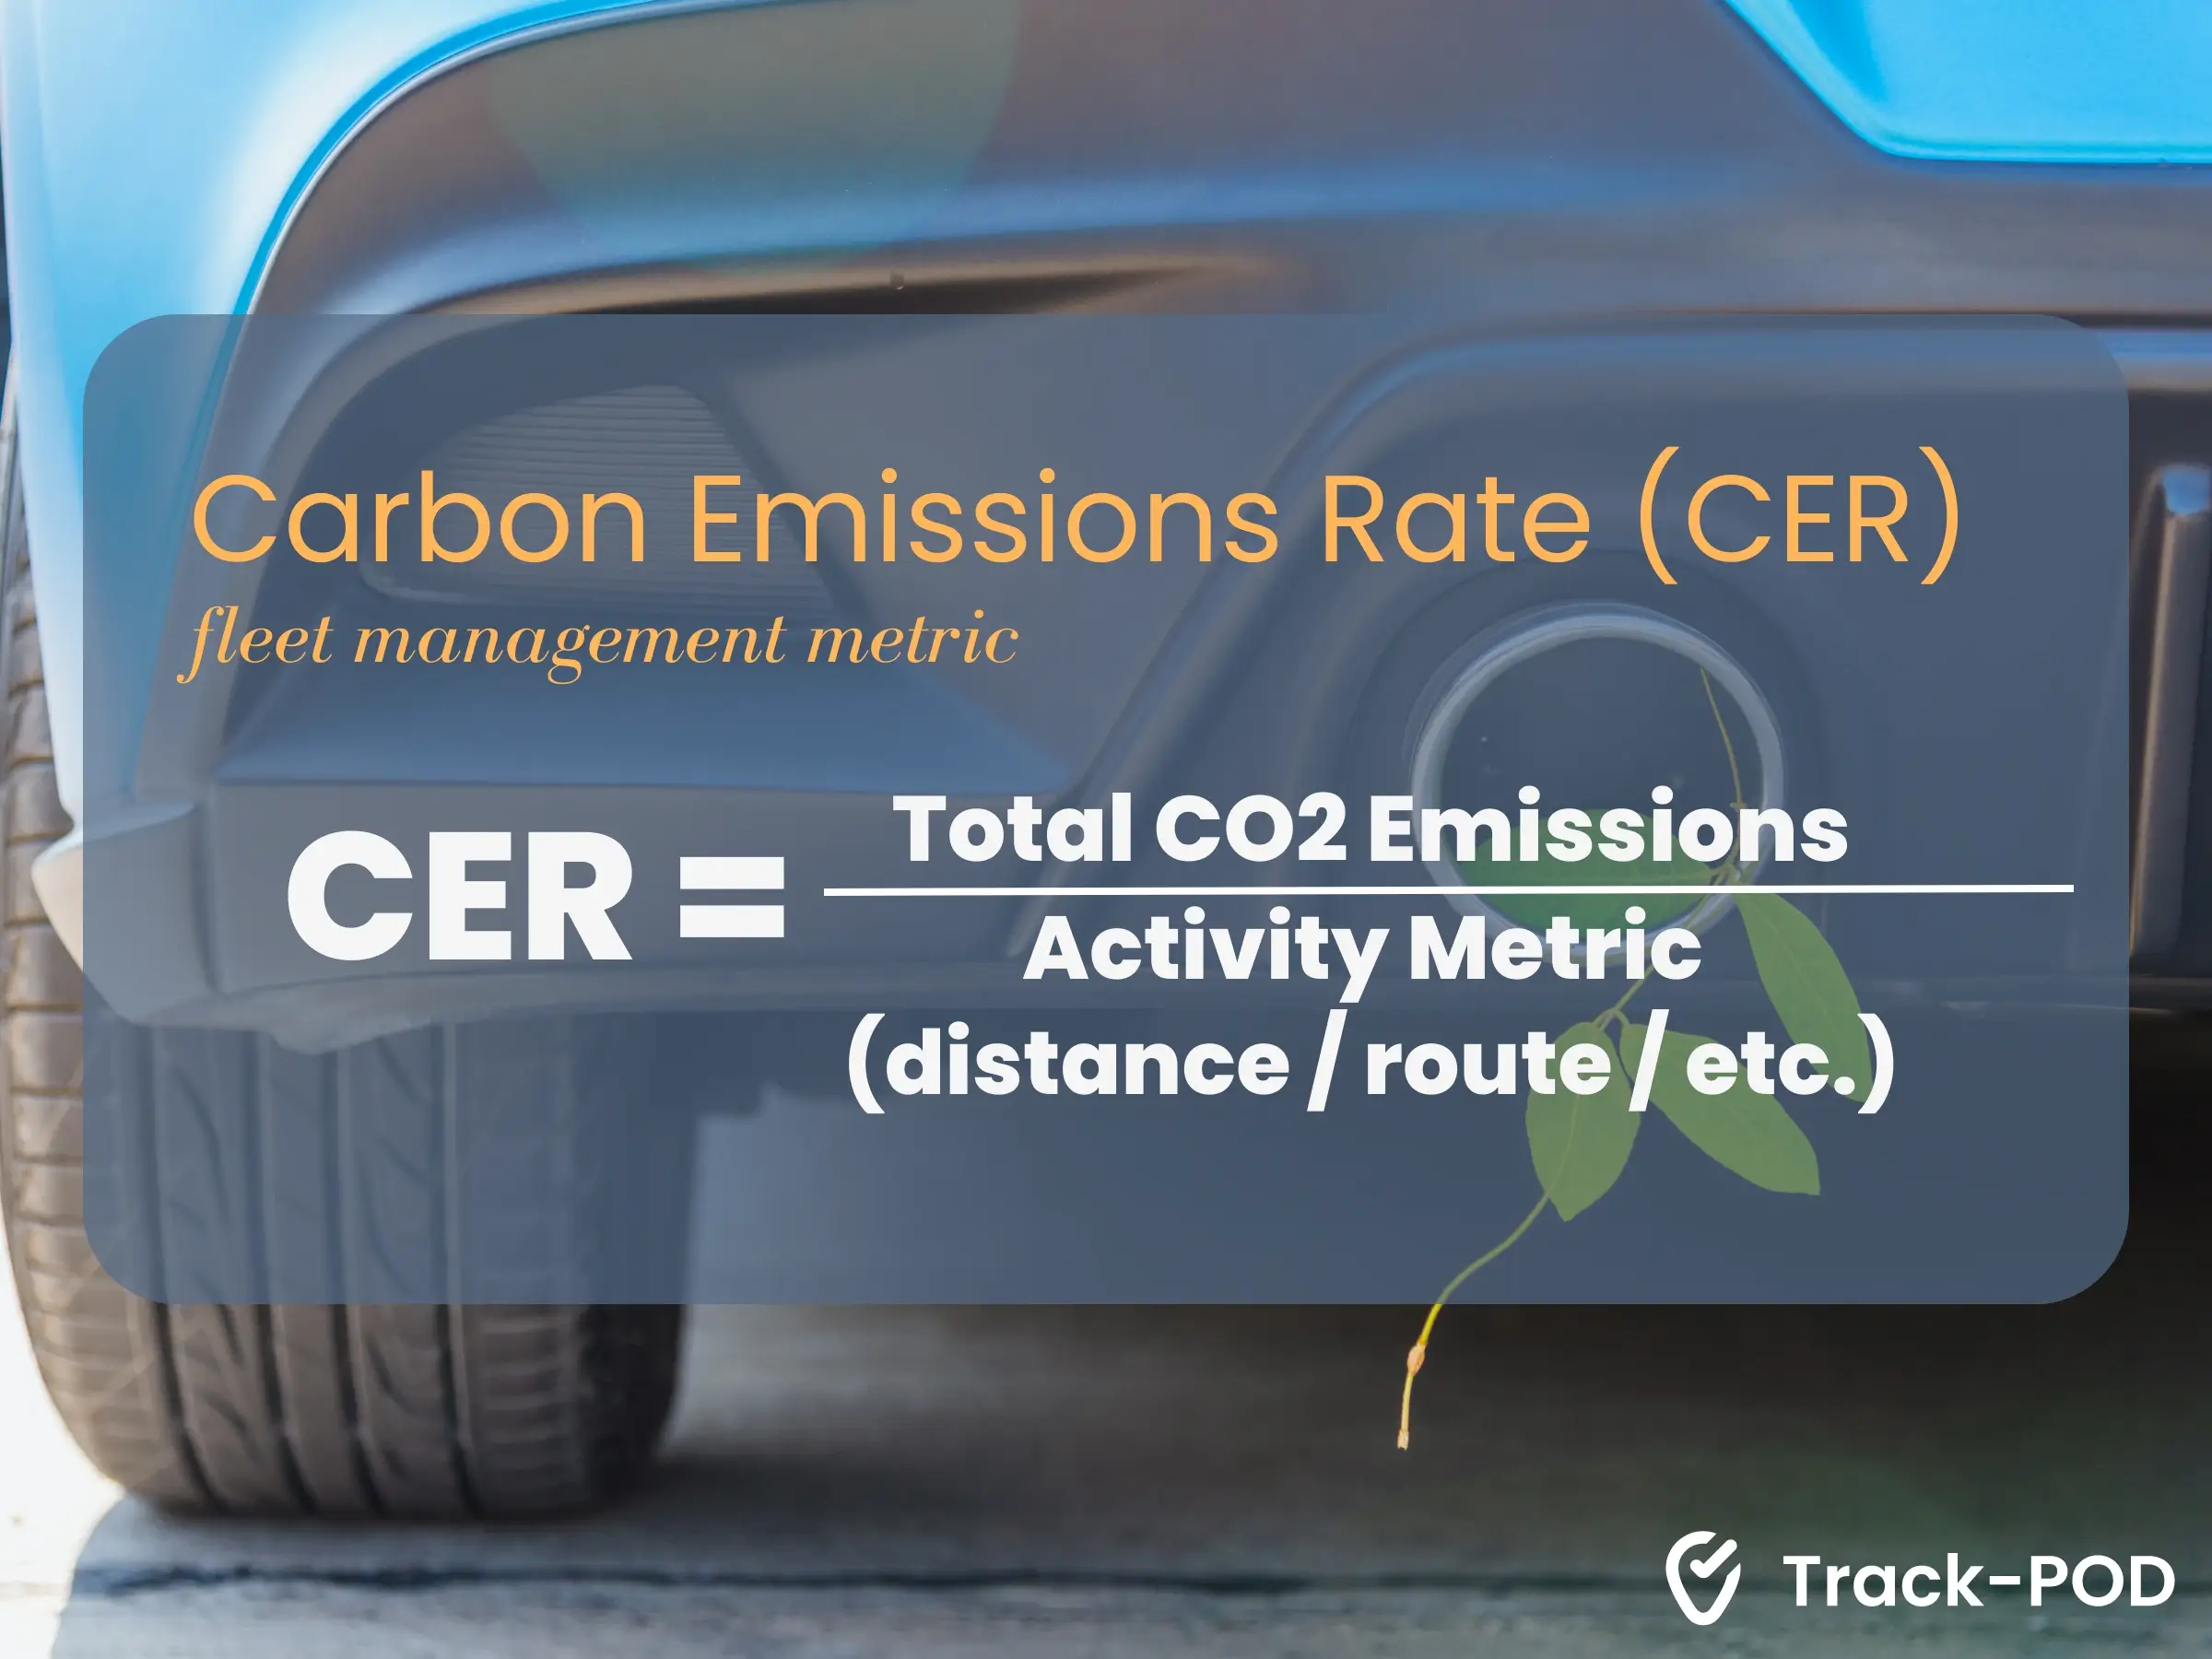
Carbon emissions rate (CER)
This green logistics metric tracks the fleet's greenhouse gas emissions.
Calculating the carbon emissions rate involves determining the amount of carbon dioxide (CO2) emissions produced per unit of activity, distance, or other relevant metrics.
The formula for the carbon emissions rate is the following:
CER = Total CO2 Emissions / Activity Metric
Eco-driving score
This fleet operations metric assesses driver behavior in terms of fuel efficiency and emissions reduction practices.
Standard parameters include smooth acceleration, gentle braking, consistent speeds, and minimizing idling.
To calculate the score, you can assign a point system to each driving behavior. Then, you can sum the points earned by the driver for each monitored behavior. To receive the final score, divide earned points by the maximum possible points:
Eco-Driving Score = Total Points Earned / Maximum Possible Points
Operational fleet metrics
Operational fleet metrics provide valuable insights into a vehicle fleet's day-to-day performance and efficiency.
These metrics help to identify the pain points and take corrective actions to improve overall fleet performance.
Delivery/service time
This fleet KPI measures the time taken to complete deliveries or services.
Calculating delivery or service time involves determining the duration a vehicle / courier takes to complete a delivery task.
The ultimate formula is below:
Service Duration = Service End Time - Service Start Time
On-time delivery (OTD)
On-time delivery metric tracks the percentage of deliveries or services completed on schedule.
In one of our recent blog post, we've covered how to calculate and improve OTD metric.
Customers, the company's reputation, and the bottom line may all benefit from a strict commitment to delivery deadlines.
Plan vs Actual
The "Plan vs Actual" metric in fleet management refers to comparing the planned delivery tasks for a fleet of vehicles and the actual execution of those activities.
This metric assesses how well the fleet's operations align with the pre-established plans and schedules.
Pro tip: Check Track-POD’s analytics dashboard for a detailed breakdown of Plan vs Actual report. It provides excessive data on Plan vs Actual Distance and Time.
Final words
Measuring fleet performance through delivery analytics offers significant benefits to businesses.
The choice of metrics depends on the specific goals and priorities of the logistics operation.
Let's summarize some of the positive changes you will notice after implementing this data-driven method:
- Fleet management metrics can help your business save money on resources by finding gaps and cutting costs linked to fuel, maintenance, and downtime.
- Vehicle utilization rates can help find bottlenecks and places where trucks aren't being used at their full potential.
- By keeping an eye on driver behavior and accident rates, you can improve safety and overall delivery efficiency.
- You can achieve proactive maintenance management by tracking delivery schedules and costs and minimizing breakdowns.
- Your company can implement greener logistics practices by looking at pollution and fuel economy.
- Benchmarking against industry standards can drive growth and competitiveness in a changing market.
This data-driven approach will help your business build a highly functional, effecient, and performing fleet.
About The Author
Alina Kostukova
Skilled marketing content creator with a background in digital media and public relations. Focused on creating first-rate text and visual content that stands out and tells compelling stories.